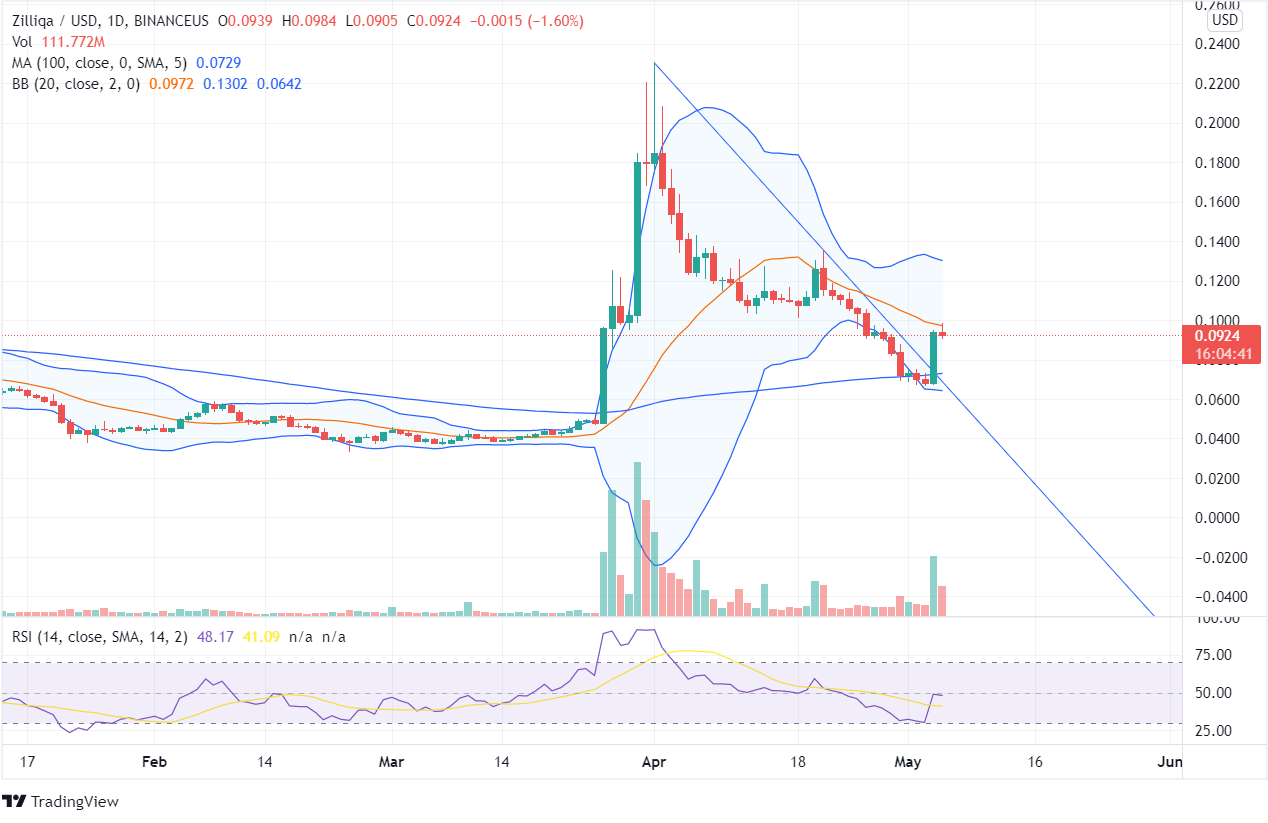
Zilliqa plunged until May 02, after which the token took a turnaround yesterday with the formation of bullish candles and taking the price upside. In yesterday’s intraday session, the coin showed an upsurge of 50%, thus giving the bulls hope for an uptrending market. The bullish candle has recently hit the downtrend line with a favorable volume taking the ZIL price to its peak.
The token formed lower low peaks until May 03 and decreased over the past several days. However, the price shows a bounce back from the current level, thus giving profit to the bulls. In the long run chart, the previous week’s bearish candle showed a drop of 66%. However, the volume bar didn’t show much support, and the price didn’t close below the previous candle’s low.
The above chart reflects that Zilliqa’s price has risen from its lower bands with the constant formation of the bullish candles, and the bulls have taken the price to the upper Bollinger bands. There was a bullish divergence in the chart in between the RSI and the price, which has been confirmed by the price closing above the peak of divergence, which is $0.0881. The token has closed above the previous lower peak, and the width in the bands shows high volatility in the price of ZIL tokens.
Read this Zilliqa Price Prediction to see that it has recently reversed from the oversold zone and is approaching overbought territory. The coin was moving at the edges of the lower bands; however, recently, the candle showed its movement toward the upper bands. Once the ZIL coin closes above the high of $0.1355, traders can expect the price to reach higher highs of $0.2304. On the other hand, the marker decline could push the price down to $0.0394.
The technical suggests a bullish momentum needs stimulus from the investors, which will be gainful for the bulls to push the price towards resistance. The ZIL bulls need to attack the market with immense buying pressure, or if they fail, the sellers will get the chance to push the price down in the near term.


