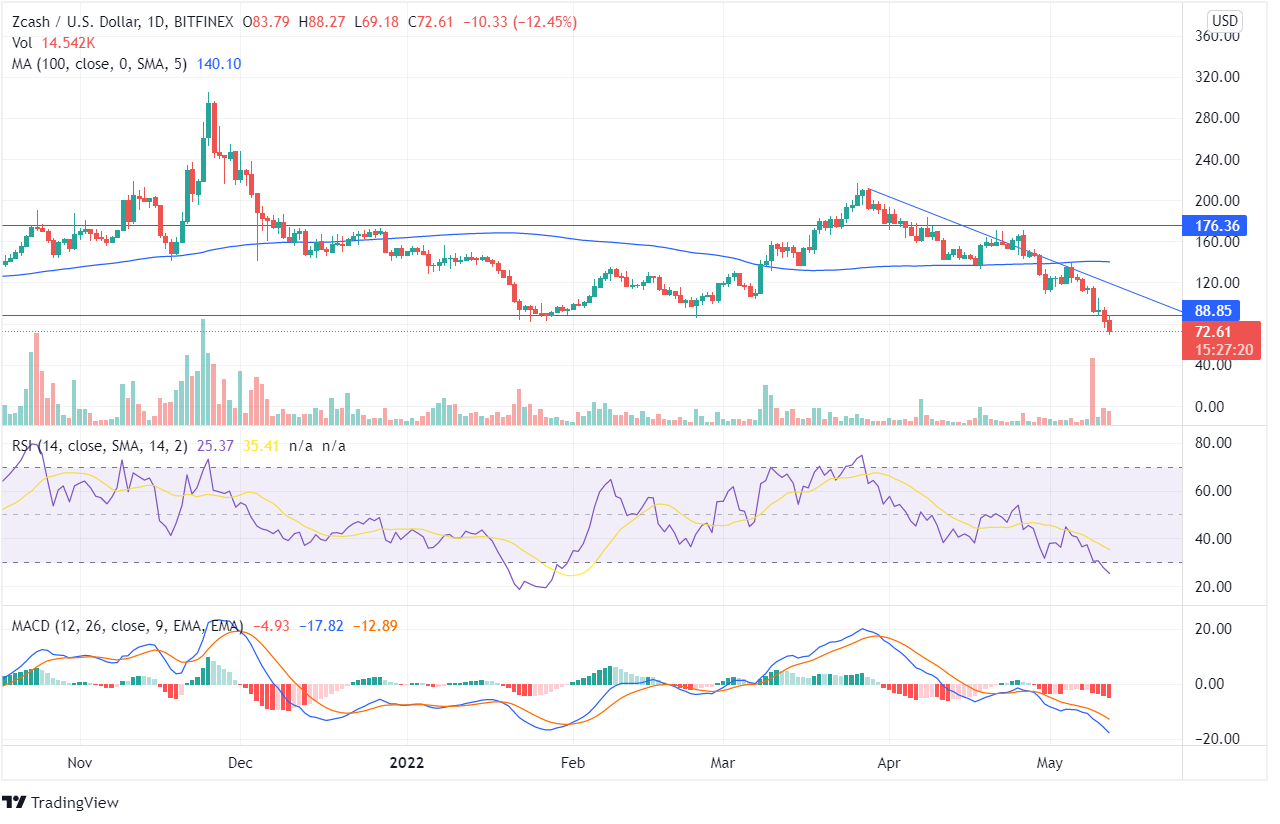
Zcash shows strong bearish momentum as the price closes below the recent lows and continues to drop below the support line of $88. The Zcash is currently priced at $72.61, with an overall price move of -47.41% this week.
The bearish engulfing pattern near the trend line shows the downfall of the price from its resistance zone. The trend line indicates that the ZEC downfall is quite strong.
The price got tested several times at the trend line on the long run chart but has failed to rise and has descended to its lows. ZEC may reach its lower support line of $51 if it continues to reduce; further, if it closes below $51, it may reach its lower lows of $26.
On May 09, there was an immense bear volume with a significant decline. The RSI is at 25, has entered the oversold zone and shows that ZEC’s price may continue to reduce before turning towards the overbought zone.
The price is below the 100 days moving average, which signals that the token was already in a downtrend. The MACD line is trading below the Signal Line, and the histogram chart also shows red candles. The coin has declined significantly since the MACD indicator gave a ‘Sell’ signal.
The investors looking for a bullish opportunity can wait till Zcash closes above the Support line, and the indicators show a ‘Buy’ signal while they turn around from their bearish zone.
In the current scenario, the Zcash token is strongly moving towards its lower lows, thus providing a gainful return to its bears.


