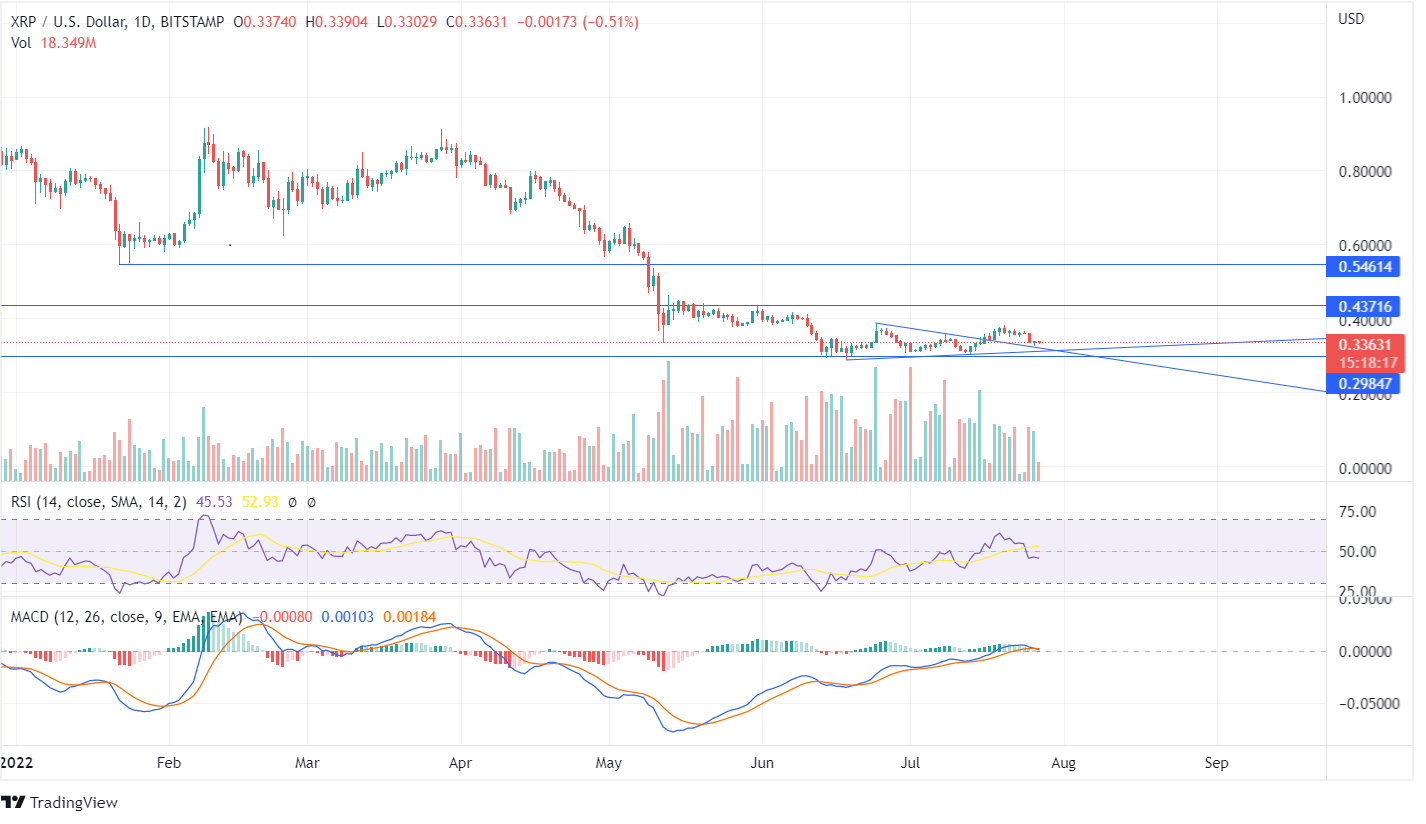
XRP has been in a tight range for the past 6 weeks. The price has been trading between $0.39 to $0.29, forming a consolidation pattern at the support area of $0.30. This stall in the movement of prices comes after a sizable drop in value which began in March-end. The XRP price kept falling till it reached $0.28, where it finally found support.
The MACD indicator formed higher highs, but the price could not rise, leading to a bearish crossover. Once XRP prices begin to form higher highs, an upside momentum can be expected. The histogram chart shows diminishing green candles. Once the bulls show positive interest and push the price upside, an up-trend can be expected. Read our XRP forecast to determine when the bulls will push the token price.
The XRP price has shown rejection for the further downfall from the support line and is taking the support of the up-trend line extending over from June 18. There isn’t a strong correlation between the price and the RSI indicator as the price hasn’t risen as compared to the RSI. The RSI indicators show higher peaks, but the price hasn’t yet closed above the recent high peak of $0.38.
The token entered the oversold zone during June and has shown a turnaround. The 45 value of RSI currently shows neutral price action. The volume bars currently move unfavorably as there hasn’t been any major price movement.
In the previous week, the price mounted up, giving the bulls hope for a bullish opportunity. The price of XRP may reach near the resistance of $0.43 if the candles continue to rise in the upcoming days. The indicators in the long time-frame chart are currently in the bearish zone, and the investors for long-term trading should wait for the forming candles and for the price to close above $0.43.
The XRP value moving in a consolidated zone represents that neither the bulls nor the bears are able to take the price in any direction, thus forming indecision in the market.


