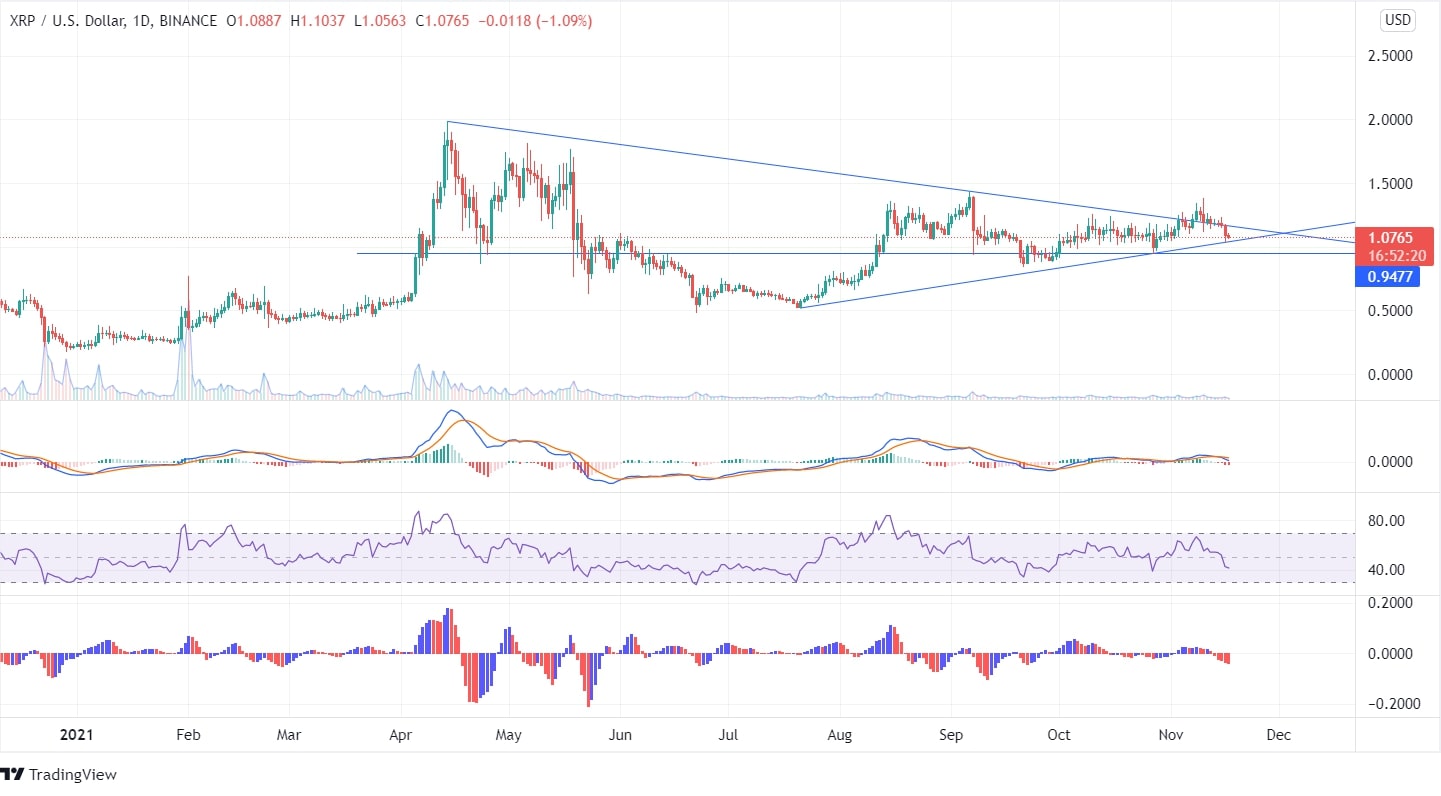
XRP is a well-known cryptocurrency like Bitcoin and Ethereum. At the beginning of the year, the coin has risen from its low of $0.26 to a high of $1.98 giving a humungous return to its investors in 4 months. However, from the mid of April, the coin has begun to fall constantly and reached its low of $0.51. The coin is currently moving in a downwards direction with the CMP of $1.08. In an intraday session on November 16, there was a fall of 13% in the price.

In the daily chart, there is a bullish divergence between the price and the indicator accelerator oscillator. Thus, if the XRP coin price uplifts from this point and crosses its recent peak of $1.38, a bullish momentum can be expected in future.
In the daily chart, MACD indicator shows MACD line is below the signal line and the histogram chart shows red candles denoting a bearish move. The RSI is at 41 and is heading towards its oversold zone. Thus, the technical parameters are in favour of bears. The volume looks more favourable towards the bears.
In the 4-hour time frame, the price coming down may touch the upward trend line. However, further analysis may depend upon the price crossing the trend line in any of the direction. The current position of the XRP coin is at a crucial point as it moves between the uptrend line, downtrend line, and support line. If the price breaks the support line and moves downwards, the minimum target can be expected to be $0.51. However, if the price rises up from this point, it may reach to $1.43.

