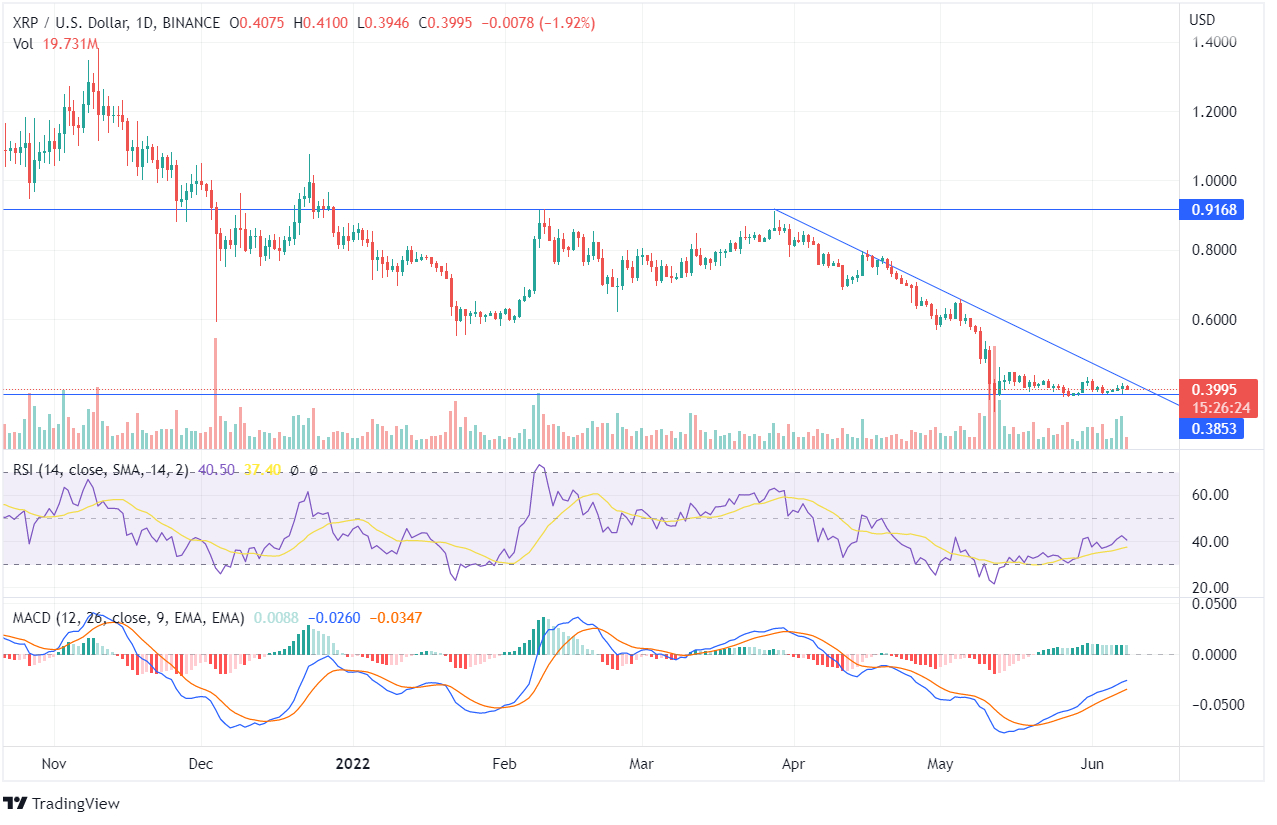
XRP has been moving sideways in the price range of $0.916 and $0.385 over the past few weeks. Like the other cryptocurrencies, XRP has also been trading in downward momentum and has reached its support zone with the current price of $0.399.
XRP price is moving below the downtrend line on the daily chart. An uptrend pattern can be expected once the token suppresses the trend line and closes above it, forming higher high peaks. The forming candles show small price movement as the price moves sideways, forming an indecisiveness between the bears and the bulls regarding the upcoming price action.
There was a supportive bear volume on May 11 & 12, but the price couldn’t close below $0.332. The XRP token entered the oversold zone. However, if the bulls show some positive price action, RSI may head towards the overbought zone. This may help the price to move towards its resistance of $0.916.
Currently, the RSI indicator is trading at 40, indicating neutral momentum. The MACD line is trading above the Signal Line, with green candles in the histogram. As per the XRP forecast and the indicators, it is a buy signal.
On the weekly chart, the price has been declining with the formation of bearish candles over the past few weeks. For the past 2 weeks, the XRP price has been tested at the Support Line but has failed to move below it, and the rejection for the decline in the longer time frame chart can be an opportunity for the bulls.
Investors can enter the bullish trade once the XRP price closes above the recent high. Or a bearish momentum can be expected if the price continues to fall and closes below the support line of $0.385.


