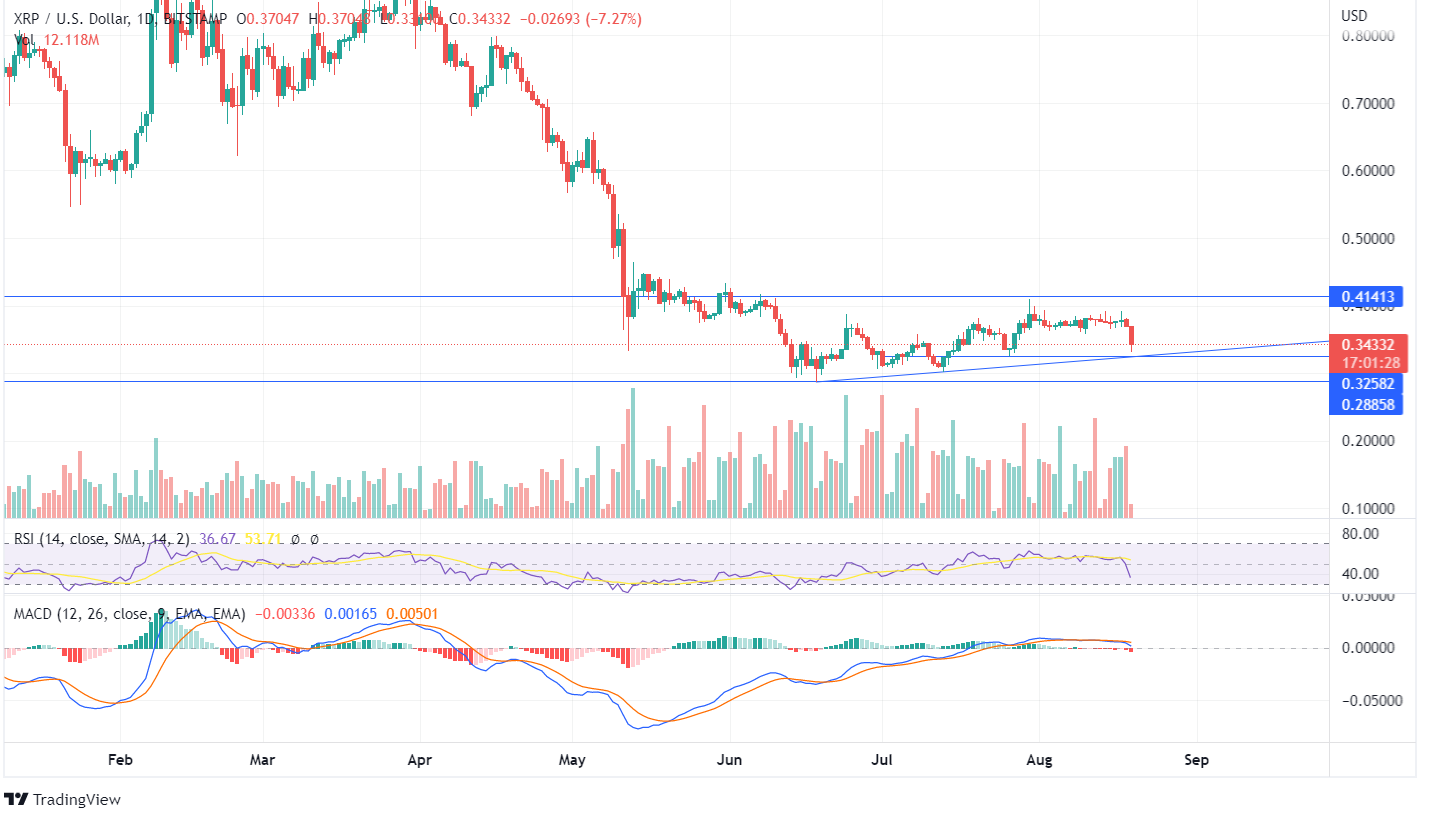
XRP moving at the current price of $0.34 shows consolidated momentum. There has been a remote price movement during the last few days, and the XRP coin needs additional buyers to push the price upside.
Yesterday, the token declined marginally and the XRP volume shows favorable support for the bears, and the forming bearish candle also shows a remarkable decline in the price. Once the XRP price hits the up-trend line on the daily chart and turns from the same point, an up-trending pattern can be expected.
Currently, the RSI value is 36, and it is tilting down showing that the token may enter the oversold zone. The MACD indicator marked a bearish crossover, and the Signal line is trading above the MACD line, indicating negative momentum. Read a detailed analysis of the token in our XRP prediction.
On the weekly chart, the forming candle closes below the low of the last 2 weekly candles. There is strong selling pressure by the bearish traders pushing the price down. The XRP price was in the oversold zone in the last few weeks and may re-enter the oversold zone.
The investors should wait for upcoming price movement before entering the trade as the XRP crypto is trading in between the sideways channel. If the coin continues to decline in the long run, it may reach its lows of $0.22. However, if the price closes above the immediate resistance of $0.41, it may lead to a bull run.


