Steller’s attempt to replace XRP’s place at Moneygram can open new avenues for this cryptocurrency as it upscales its use case. While Ripple has been severely thrashed after the SEC lawsuit, its competitors, such as XLM, have been gearing up. Since XLM was founded by a Ripple co-founder named Jed McCaleb in 2014, it offers a significant improvement over XRP’s potential and scalability.
The unique goal of XLM to facilitate exchange transactions among various assets, including fiat currencies and other cryptocurrencies, has portrayed it as a currency with the potential to further upscale to new heights.
XLM Price Analysis
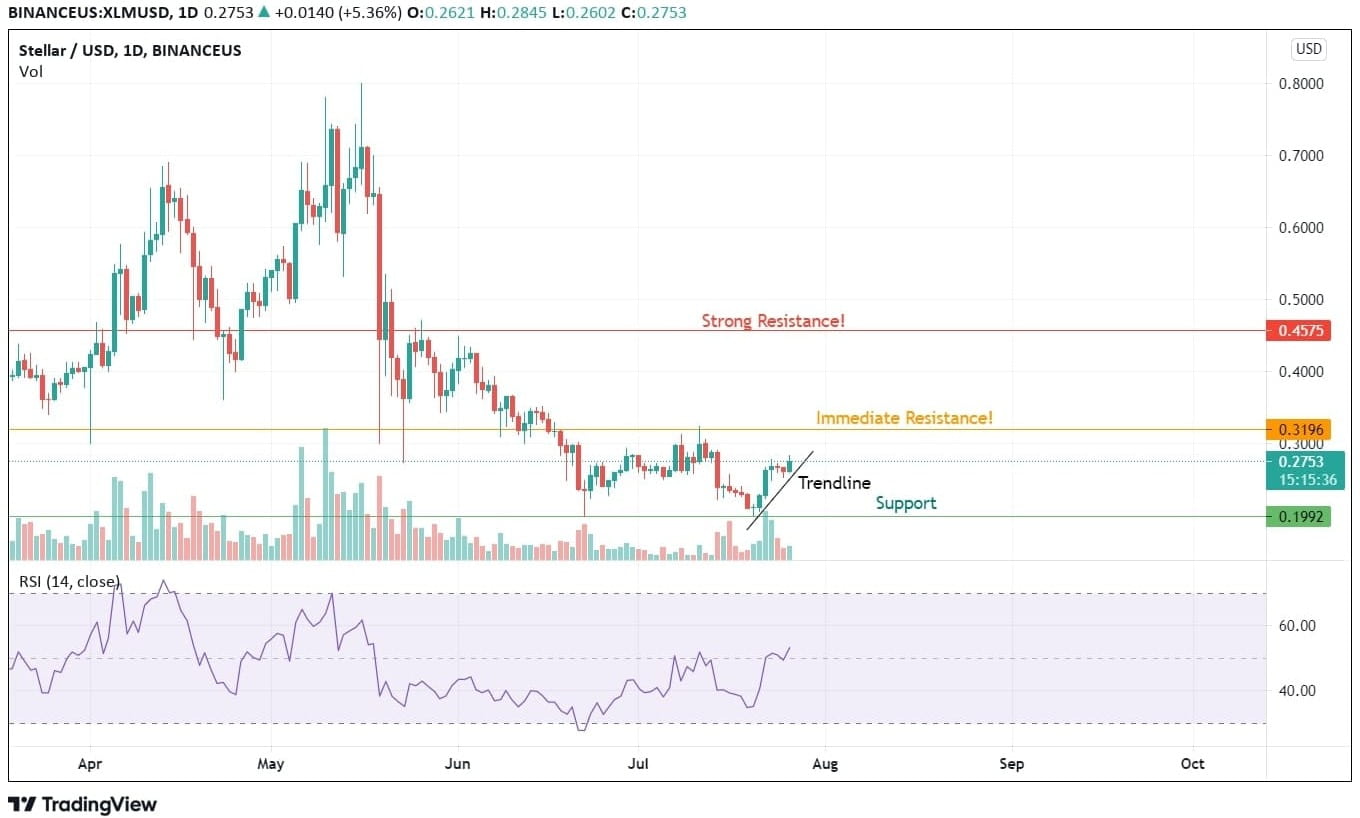
XLM has brought back investor interest because of its lower valuations. Since touching the low of $0.1989 on July 20, 2021, this cryptocurrency is up by almost 40% in just a week. The stringent buying action seen at a lower level is even stronger than the one witnessed from the same levels of June 22, 2021. Whatever might be the reasons, this bullish rally is still to overcome the resistance of the last swing.
The news of Stellar acquiring Moneygram has sent huge shockwaves allowing XLM to break out of its downgrading range. Using technical indicators and price momentum, we can better assess the future potential of Stellar Lumens in the days to come.

Immediate Support: $0.1992
The consolidation of the last few days is again broken with a subsequent rise of today’s green candle. Taking support from its previous support for the entire momentum of 2021, XLM is indicating a strong potential to cross its all-time high. Since the stellar price prediction action synchronizes with the lower valuation and the news of XLM acquiring Moneygram, there is a lot of potential in this positive momentum to sustain in the longer run.
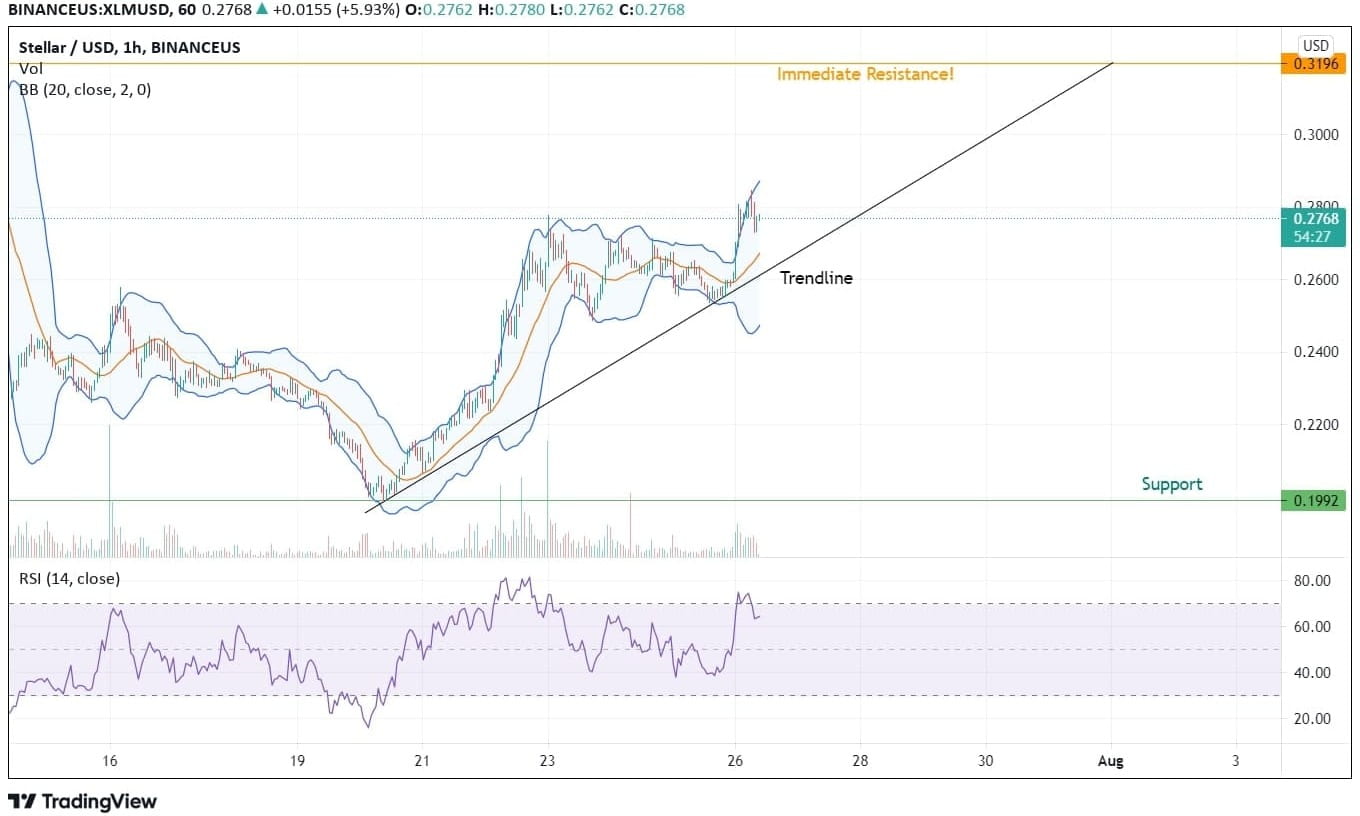
The immediate resistance of $0.3196 is a strong level that has pushed back the XLM rally multiple times; hence traders and investors should be careful around the level. A strong momentum would be XLM crossing the resistance line without any retracement on hourly candles. Turning this resistance to support is the best way of transforming the negative sentiment on XLM into a bullish rally to reach past $1.
RSI is showing some signs of recovery, too, with its steep incline towards overbought zones. The last time RSI reached overbought zones, XLM was close to $0.60 levels. Hence the sustenance of this level will be a crucial factor in the current rally.

XLM is also respecting its trendline on hourly charts. As such, it will be exciting to witness further price action. As per this trend, there is no weakness in XLM, and we can witness its rise towards $0.50 once it can breach the $0.3196 levels on charts. RSI on hourly charts is immensely bullish, currently trading close to the overbought zones.

