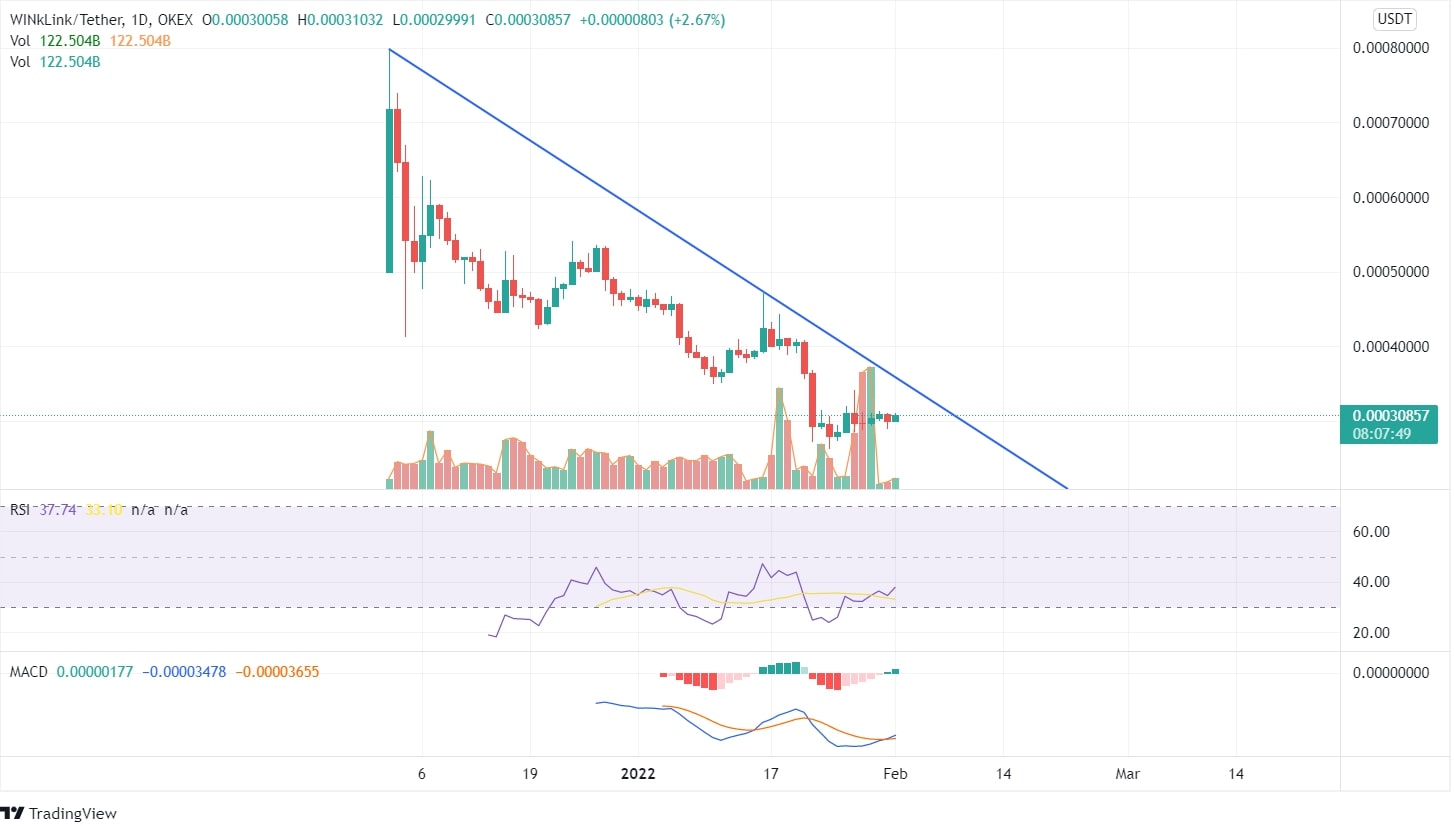
Winklink is moving at its lows of $0.0003 after dropping from its peak of $0.0007 in December. The coin tested at the downtrend line on January 16 but failed to rise and formed lower low peaks. There has been remote price movement in the past few days and the coin is moving sideways. In the past two months, the WIN coin has been correcting and registered an almost 133% decline.

The RSI indicator being at 38 has turned from its oversold zone and may head towards its overbought zone. There can be a buying opportunity for the bulls in the long run if the price breaches the downtrend line in the upcoming days as per Wink coin price prediction.
On the weekly chart, the price is moving at the edges of the downtrend line and hasn’t yet closed above or below the trend line. There is a dogi candlestick pattern in the forming candle. There was a price movement of 50% value in the previous week bullish candle formed.
The bulls may expect an uptrend if the price closes above the swing high or down trend line in daily chart and the bullish divergence gets confirmed with a candle closing above it. However, if the coin continues to fall and closes below the swing low of $0.00026, a bearish opportunity can be expected.

