

This week, the crypto market witnessed a bullish turnaround despite the tariff war between the United States and the European Union escalated. As a result, Bitcoin price reverted from $80,000, while top altcoins like XRP seek suitable bottom support. However, the declining investor interest in the derivatives market and a bearish pattern in the Ripple cryptocurrency highlight a different outlook.
Highlights:
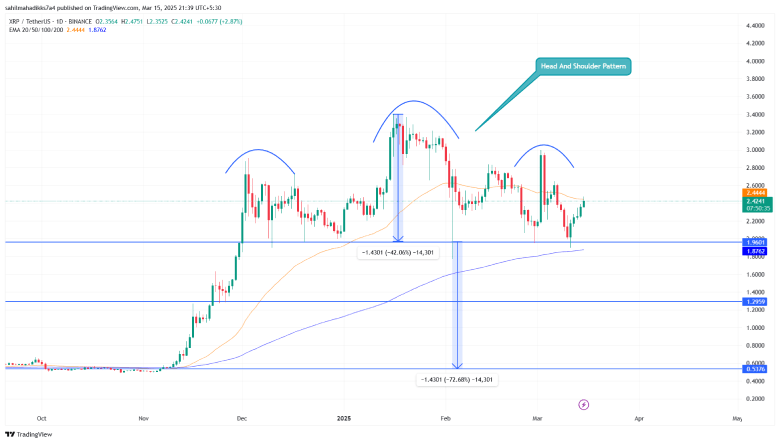
- A head and shoulder pattern drives the current correction trend in XRP.
- XRP’s OI-Weighted Funding Rate turned negative (-0.0124), signaling dominance of short positions.
- The XRP price is barely 12% short from teasing a bearish breakdown below multi-month support of $2.
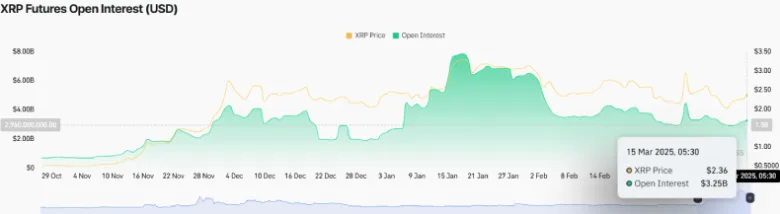
Bearish Signals Mount for XRP as Futures Open Interest Drops
Over a week, the XRP price showcased a bearish reversal from the $2.96 top to $2.25 current trading value, registering a 32.8% loss. Consecutively, the asset market cap fell to $1300 Billion
Following the same momentum, XRP’s Futures Open Interest plunged from $4.45 Billion to $3 Billion projected a loss of 32%. This trend suggests a sharp reduction in leveraged positions, indicating that traders are either closing their contracts or facing liquidations amid heightened volatility.
Adding to the bearish note, the OI-Weighted Funding Rate has recently slipped into the deep negative region of 0.0124 suggesting that short sellers are dominating the market, forcing long traders to pay a premium to maintain their positions. Historically, a negative funding rate has accelerated market selling sentiment and driven a prolonged downtrend, as it indicates that traders expect further price depreciation.
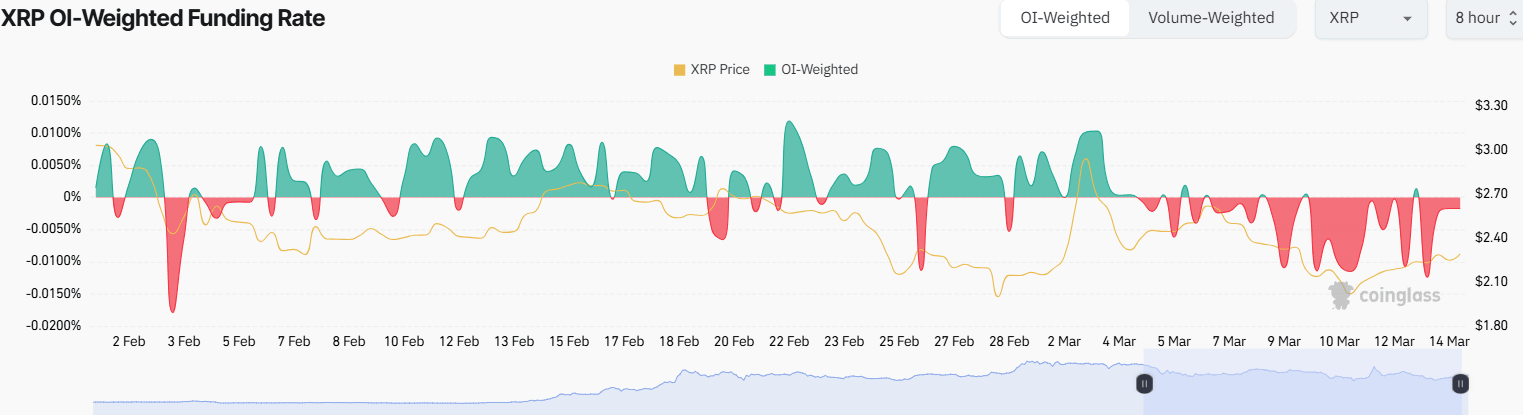
Furthermore, a declining Open Interest coupled with a falling price and negative funding rate signals an ongoing deleveraging phase, where bullish positions are being liquidated, and bearish sentiment prevails.
XRP Price Is Nearing A Major Breakdown
XRP Price analysis of daily charts shows the aforementioned reversals lead to the formation of head and shoulder patterns. This chart setup is commonly supported at major market tops and is characterized by three peaks where the middle extends higher than the two of nearly the same height.
Generally, these three rejections indicate intense overhead supply which pressurizes the asset price for a breakdown below neckline support. If the pattern holds true, the XRP price could plummet 12% and tease a bearish below $2 floor, paving the way for prolonged correction. The post-breakdown fall could push the asset 34% to seek $1.3 support.
On the contrary, if buyers manage to defend $2, the current consolidation trend will prolong and recuperate the bullish momentum for a fresh recovery.
Also Read: Solana Price Faces $100 Breakdown as First Death Cross in 500 Days Unfolds
