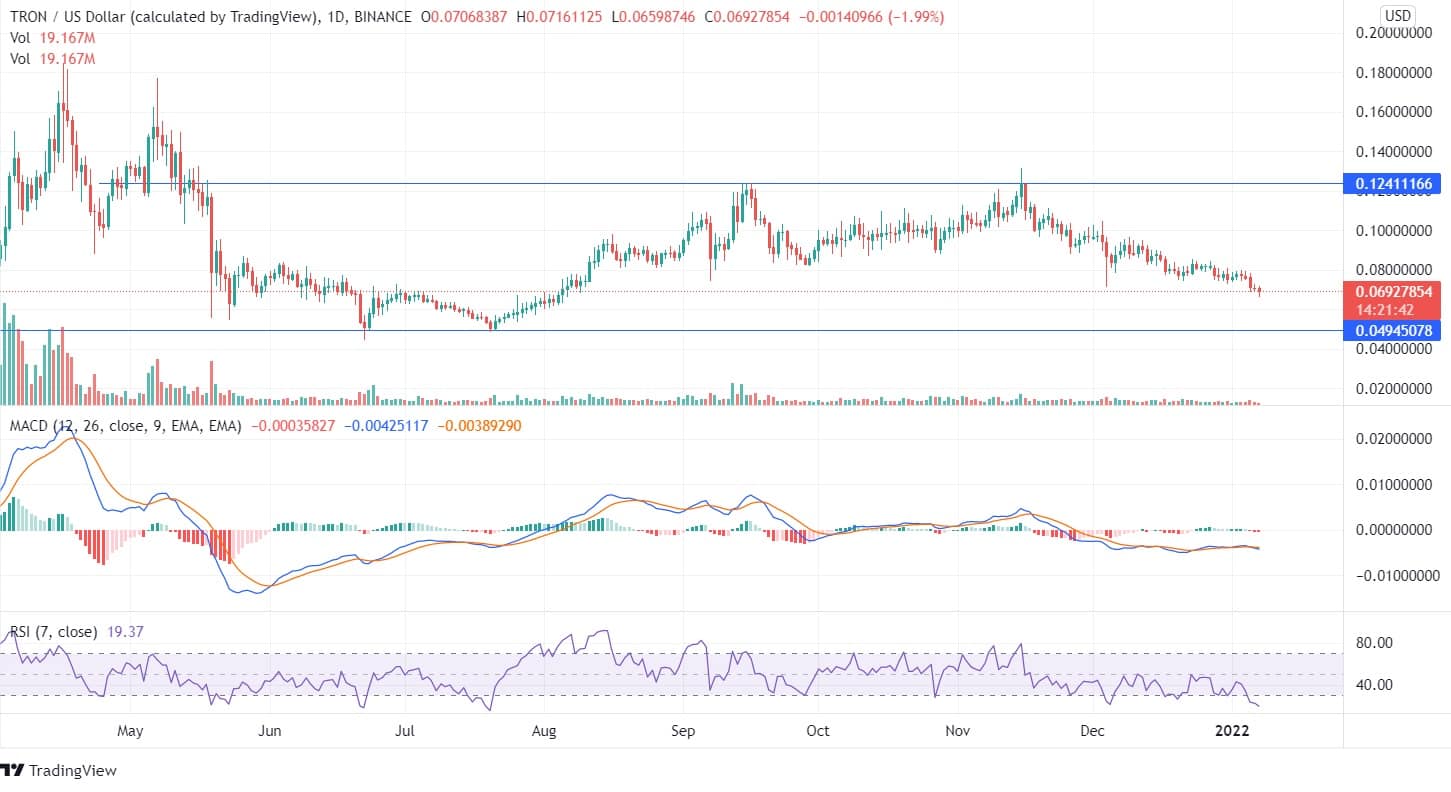
TRON is moving in downward momentum after reaching its resistance of $0.12. The coin got tested several times at the top horizontal line but failed to breach the line and uplift. There was the formation of swing highs and swing lows at the horizontal lines which was a tradable opportunity for the bears and the bulls as the price couldn’t ascend or descend from that point.
On December 04, there was a vigorous formation of the bearish candles with a swing low of $0.07 but the upcoming candles failed to close below it. However, in the past 2-3 days the bearish candles have crossed the swing low and declined further which may take the coin to its support line of $0.04. After mid-November, the coin price recorded massive plunge and continued to trade bearishly.
On the daily chart, the MACD line is below the signal line and the histogram chart are also showing red candles, thus signifying a decline in the price. The RSI being at 21, has already entered the oversold zone. The volume bar is also demonstrating bearish candles however there is not much bearish pressure in the volume candles. There has been a continuous formation of bearish candles this month and the price has fallen significantly. A turnaround in the TRX price can be expected, once the coin reaches the lower support line.
On the weekly chart, the indicators have been reflecting bearishness for the past few weeks. From mid-November onwards when the coin closed below the resistance line, a constant downfall of the coin began and is still continuing. In the long-time frame chart also, a strong bullish trend may take place if the coin doesn’t breach the lower horizontal line and the bulls push the price up.
Though the price is sloping down constantly but the volume bars are not showing much involvement of bears and there is a support in the volume candles. The coin is still declining until it reaches its support line, however soon, a bullish opportunity can be expected, and the price shall lead towards its highs in the upcoming days.


