Foundation in September 2017. The brainchild of tech entrepreneur Justin Sun, this currency raised over $58 million in an Initial Coin Offering that lasted for two days. This cryptocurrency will be enforced by bridging the gap between the content consumers and content creators by eliminating any sort of centralized platform.
TRX is based on a decentralized blockchain called TRON, while TRX is the cryptocurrency meant to authenticate and validate transactions. Highlighting the need to revolutionize the peer to peer network and distributed storage technology, TRX aims to create a free global entertainment ecosystem of digital content with the help of distribution platforms.
Technical Analysis
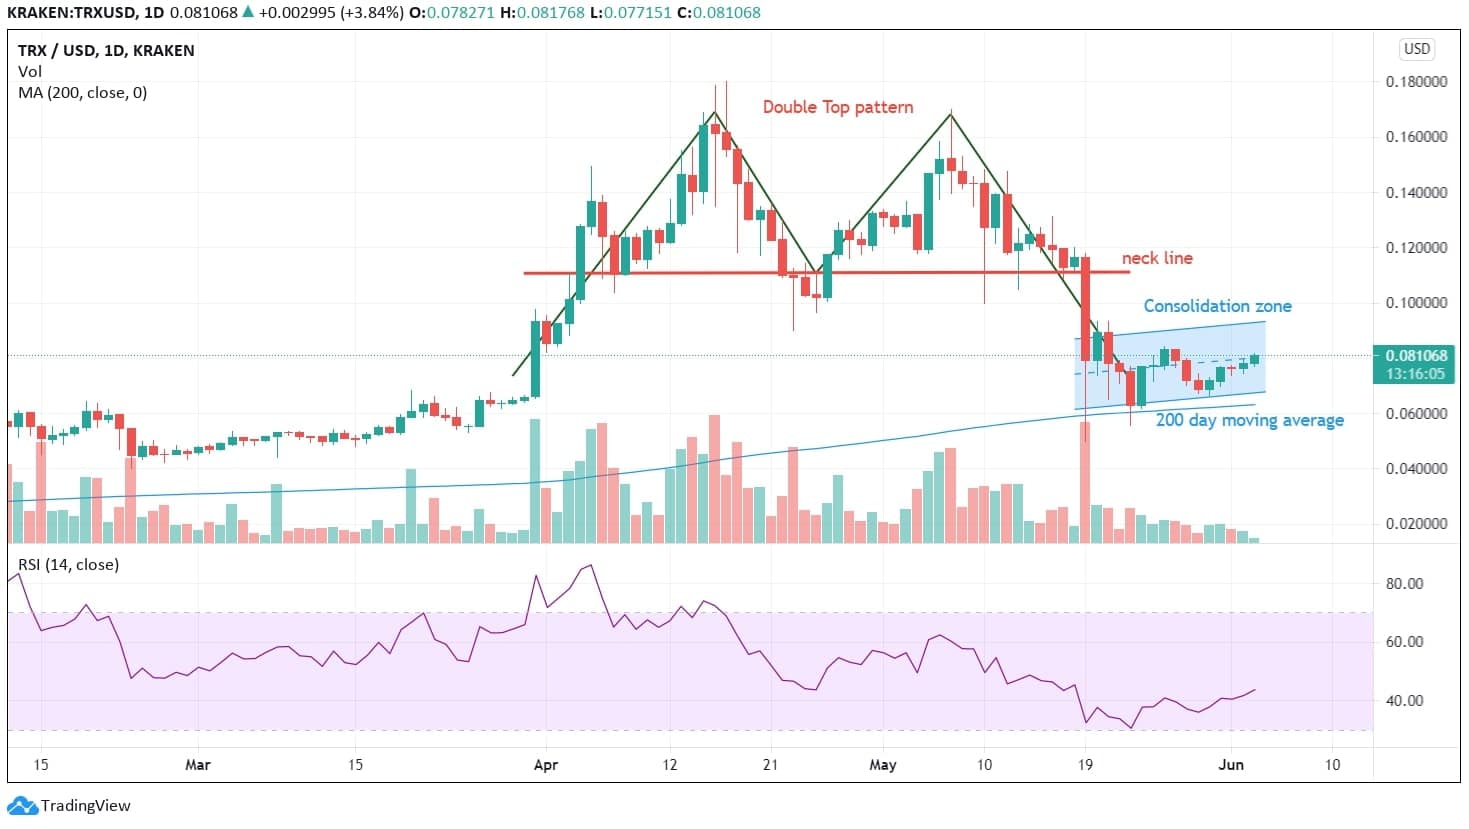
On the one-day chart of TRON (TRX), there is a strong breakout visible at the price of $0.60 on March 31, 2021. This cryptocurrency asset continued in the upward trend till it reached the all-time high of $0.178. After a strong bullish rally in the asset, we witnessed a small price correction as a result of profit booking from the higher levels. The price of TRON again witnessed the levels of $0.10, and again bounced back from $0.170.
But the correction led to the formation of a double top pattern. After breaking the neckline placed at $0.101, the double top formation pushed the asset into a bearish Movement with confirmation. Hence, the major resistance levels for the assets will be around $0.165. The current market price is hovering near $0.80 in a consolidation zone of the price range, $0.070 – $0.090.
The 200 Day Moving Average line can easily be seen as strong support for now, as prices bounced back a couple of times from these levels in the recent past days. RSI is considered as one of the best strength indicators, where a value below 30 indicates an oversold zone while the value above 70 portrays the asset as overbought. The Relative Strength Index is currently oscillating at a value near 43.3, which indicates that TRX’s value is in a neutral zone. The current value is a good entry point for fresh investments.
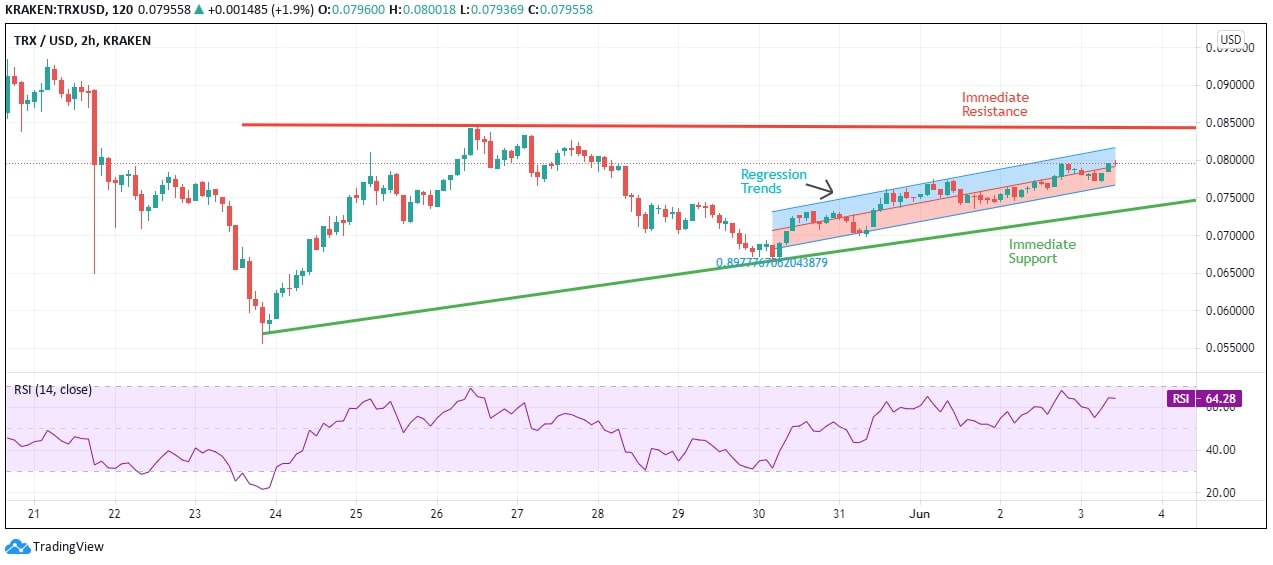
In the chart above, it can be observed that the price of the asset is heading slowly towards an immediate resistance level of $0.080. Immediate Support levels are where the price is getting bounced back a couple of times from those levels. It is forming a Rising Wedge Pattern, and breaching the support levels will be a perfect shorting opportunity for traders.
The regression trend is pushing the price higher by respecting the baseline levels. Traders waiting for fresh buying opportunities for holding long positional trade should be cautious for now. Traders can get trapped in profit booking scenarios, hence they should wait until a clear chart emerges.
Currently, a development of the Double Bottom Pattern can be seen along with the rising wedge pattern on hourly charts. But until the value moves above the resistance zone, there are no clear trades in this time frame. is getting formed near the consolidation zone and 200 DMA. Traders should wait until it reaches the neckline and then it will be a good entry point for the target levels.


