Stellar is an open blockchain network for storing and transacting money, as it works with almost all fiat currencies. Unlike major cryptocurrencies, the goal of XLM is to integrate with fiat currencies and improve the process of money transfer and transactions. The goal of XLM is quite ambitious as they intend to bring all the financial systems in the world on a single network expanding the reach and capabilities.
So far, XLM might sound similar to the Ripple blockchain network as it’s kind of true as Stellar Lumens was developed by Ripple co-founder Jed McCaleb. Not having the freedom to make changes on the Ripple blockchain led him to leave Ripple and create a new blockchain network, known as the Stellar Lumens network.
While Ripple is meant for the corporate sector with the intention of being a profitable business. Stellar, on the other hand, is a public, decentralized, and not-for-profit cryptocurrency. All the development work on the Stellar Network is done through the Stellar Development Foundation based out of California.
XLM Price Analysis
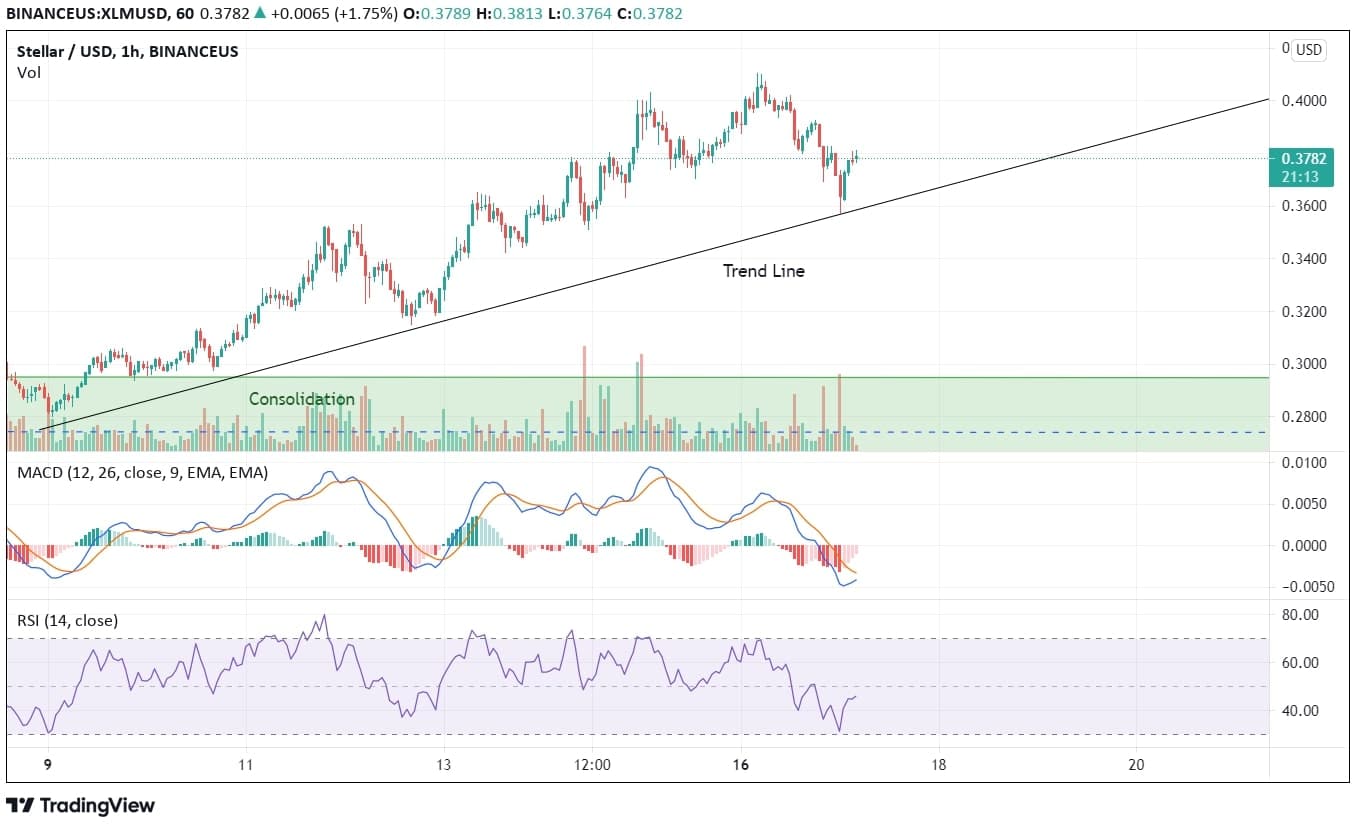
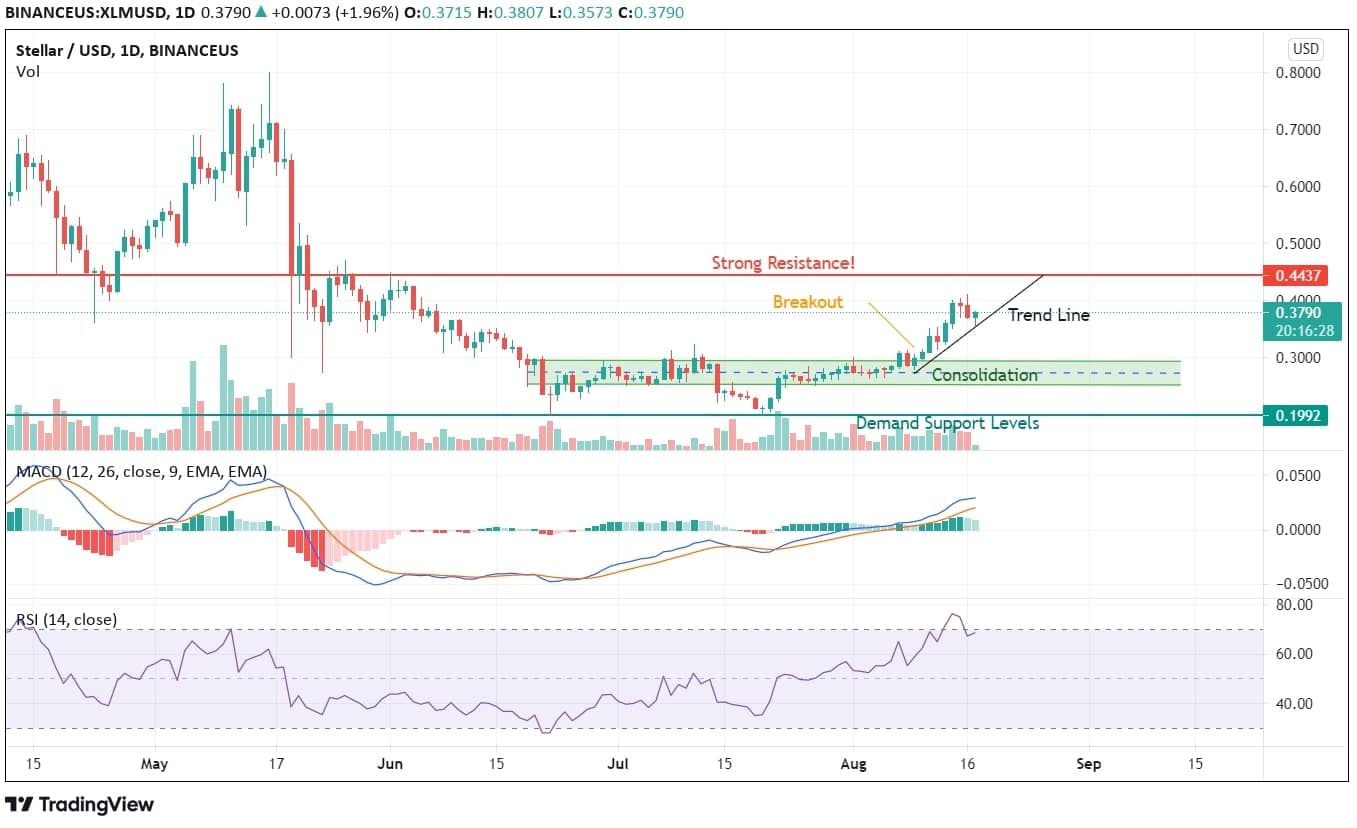
XLM has once again restarted its upside move after a small profit booking of over 10% in the last two days. But since XLM has been following its trend line, we can expect a pullback towards the recent high with an attempt to break the immediate resistance of $0.4437.
On daily charts, Stellar shows a powerful price action with a mixed bag of red and green candles. After a retracement from its recent high, XLM can be seen making a green candle with a long lower shadow indicating buying at lower levels and rejection. It also indicates that any downside retracements are being considered as an opportunity to buy.
On technical indicators, we have RSI trading in overbought zones for the first time since April 2021, indicating a strong buying sentiment at current levels. MACD is also showing good positive sentiment that can be continued in a longer time frame.
XLM has technical support levels near its recent breakout at $0.30, followed by strong support at $0.20. Having moved close to 100% in the last month, there will be some consolidation before XLM can make fresh highs. The all-time high of $0.800 seems achievable with its consistent scaling and upgrade launches. For now, XLM will face more difficulty at crossing current rejection levels than the immediate resistance levels. The buying sentiment generated at $0.41 levels will be enough to push it beyond the mentioned resistance level of $0.4437.

The MACD indicator is on its way to give a golden cross-over in a shorter time frame indicating a strong upside move above 5% to 10%. As witnessed before. Its consolidation levels on daily charts have become the support levels on hourly charts. Even though the risk to reward ratio is not favorable, XLM is shadowing a potential to follow Ripple’s road to glory.


