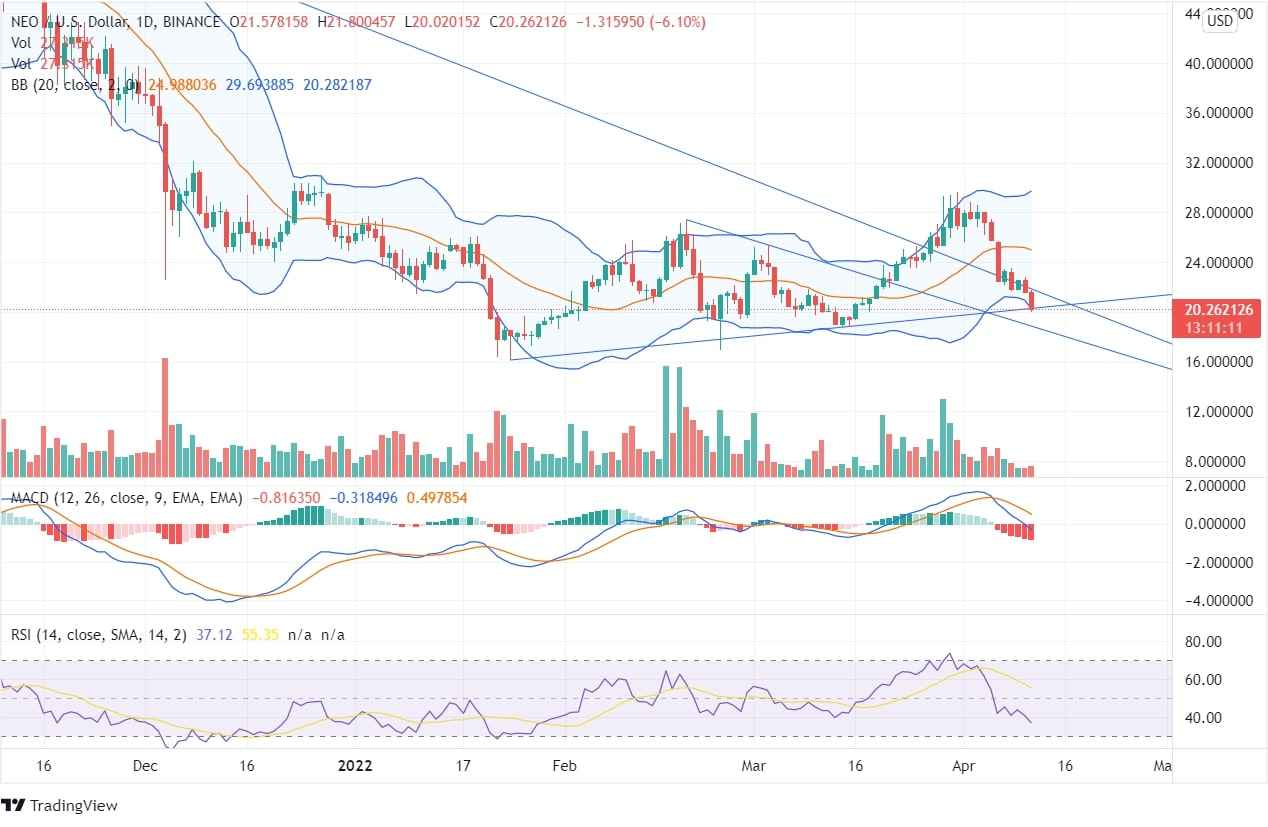
NEO is reflecting a declining trend after forming a peak at $29. The coin is currently trading just below the the edge of the up-trend line. An upcoming price action depends on the price closing above or below the trend line, as previously, the price took the support of the trend line and has ascended from the same level.
During the previous week, the coin hs marked a fall of 33%, thus covering the bullish candles formed during the last two weeks. During the March-end, the bulls tried to push the price up but couldn’t manage to trade above the resistance point of $30 and declined towards its support. Later, the NEO coin price fell and returned to the same position from where it started to arise.
The RSI being 37 is currently trading towards the oversold zone. The Bollinger bands show that the price moves at the lower bands and has closed below it. Yesterday, the NEO price registered a fall of 4%. The coin shows bearish momentum as the bears have taken the price to its support zone. The price may reflect trend reversal if, on the daily chart, the bullish candles begin to form.

