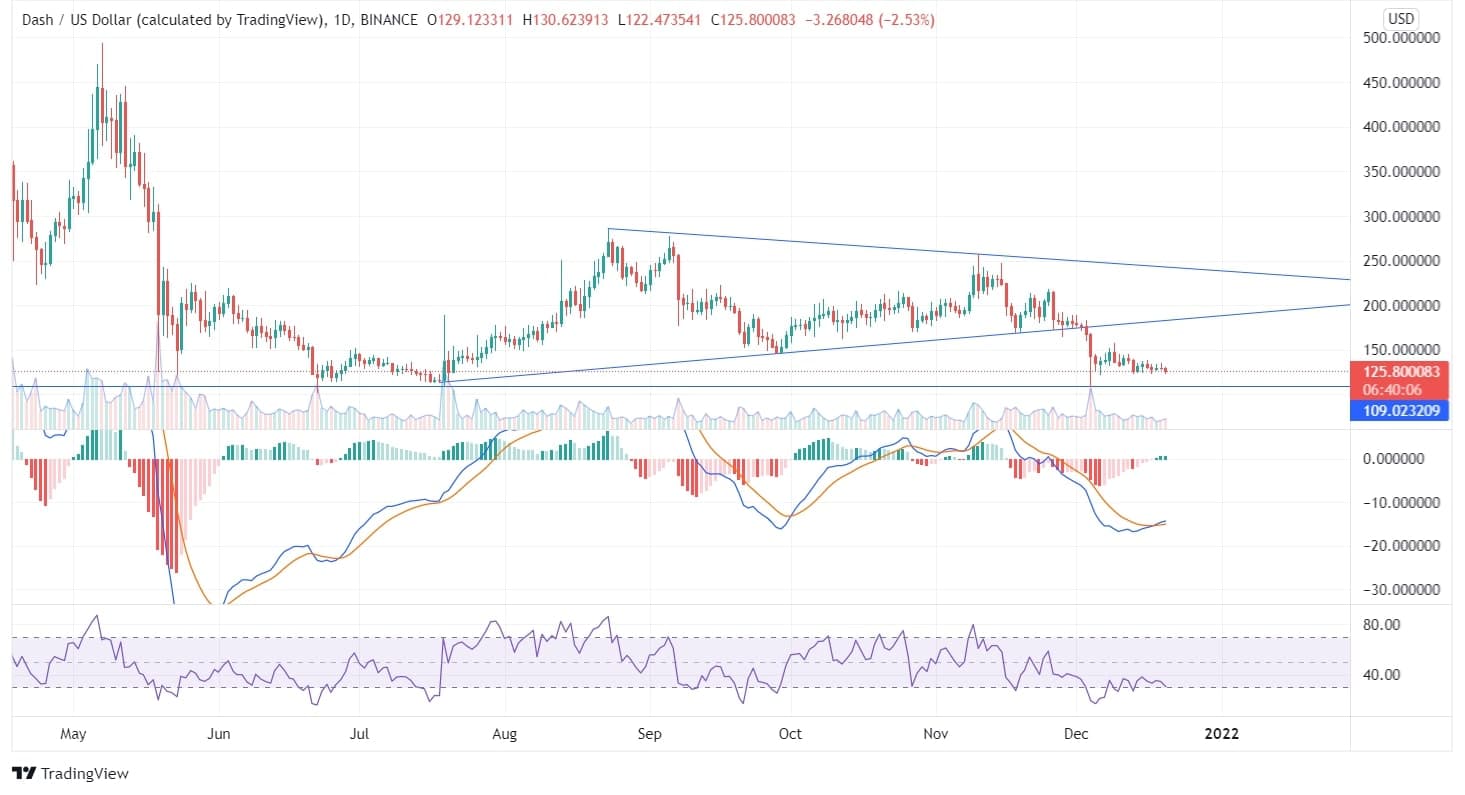
Dash has been at its peak of $440 during the beginning of May, after which it fell tremendously and reached its support zone. The coin revolved at its support zone for one month after the value fell significantly.
The coin traversed the up-trend line stretching from mid-July, and after being tested at the trend line, the coin descended and is presently moving sidewise with minor price movement.
Dash moving in consolidated momentum could not break the swing low of $107, which may lead to an upside movement of the coin as the bears could push the price down. The coin is currently priced at $129.27 and is heading towards the support line.

The RSI being 30 is in the oversold spot right now. Regardless, if the bulls push the price up, the RSI might lead to an overbought spot. The volume is creating indecision between the bears and the bulls and is unfavorable.
On the weekly graph, the token is moving in a down-trending pattern, but it couldn’t suppress the swing lows formed before. The coin is trailing above the support line, but the indicators are still in the sell zone.
The technical parameters are not indicating anything specific about the price action, and thus investors should study the fundamentals in the current scenario.

