

For the past two weeks, the crypto market has struggled to build a sustained bullish momentum, as evidenced by Bitcoin’s consolidation below $100k. The uncertain market sentiment spread to altcoins has limited recovery attempts in the majority of major altcoins, including LINK. The Chainlink price faces the risk of extended correction amid key support breakdown and a slowdown in network activity.
Key Highlights:
- A flag pattern formation governs the current correction trend in Chainlink price.
- The LINK price failed to follow up on the $19.3 support breakdown, hinting at weakness in the sellers’ stance.
- Long-tail rejection candle at the 200-day Exponential moving average indicates the broader trend is bullish.
Chainlink Struggles as On-Chain Activity Declines Since Q4 2024
According to renowned crypto analyst Ali Martinez, the Chainlink (LINK) network has been experiencing a contraction since November 30, indicating a potential slowdown in activity.
The accompanying graph reveals a notable downtrend in network expansion, correlating with fluctuations in LINK’s price. The contraction in network growth could be indicative of reduced adoption, fewer new participants, or a decline in smart contract interactions on the Chainlink network.
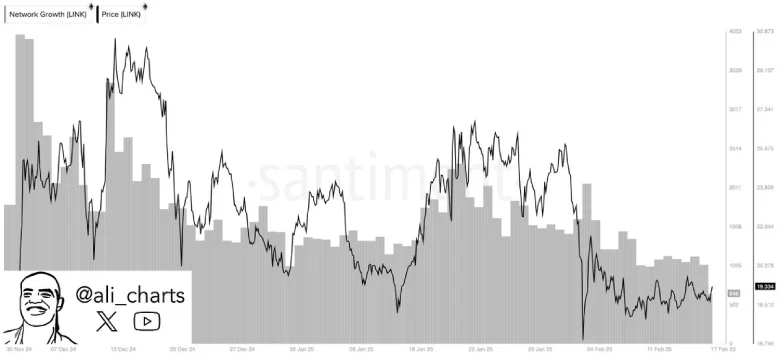
Historically, such trends can reflect lower investor interest, weaker development momentum, or macroeconomic factors influencing market sentiment.
Chainlink Price Defends Key EMA Support For Bullish Recovery
In the last two weeks, the Chainlink price dropped from $26.4 to $19.32 level, losing 26.7% in value. While the falling price gave a breakdown below $18.2 support to intensify the selling pressure, the buyers managed to hold the 200-day EMA slope.
This trend-defining moving average indicates the bulls retain control over this asset, increasing the potential for a rebound. With an intraday gain of +3%, the LINK price attempts to regain the $18.2 level. If successful, the buyers could drive a 15% surge to challenge the resistance trendline of the flag pattern.
Theoretically, the chart setup shows the dominating trend with an ascending trendline and a short-term correction to regain its exhausted momentum. Thus, a potential breakout from the overhead trendline will signal uptrend continuation and bolster buyers to surpass the $35 barrier.
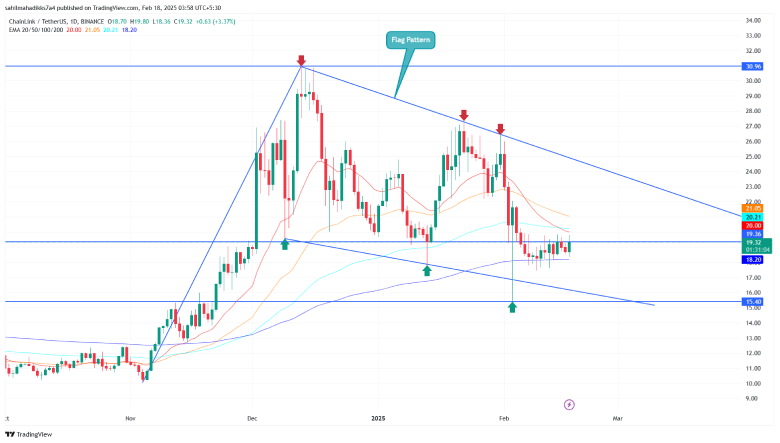
Alternatively, if sellers continue to defend the flag’s resistance, the current correction could continue and plunge 20% down to hit $15. The bottom support trendline could defend LINK from further correction.
Also Read” Texas Senate to Hold Public Hearing on Strategic Bitcoin Reserve
