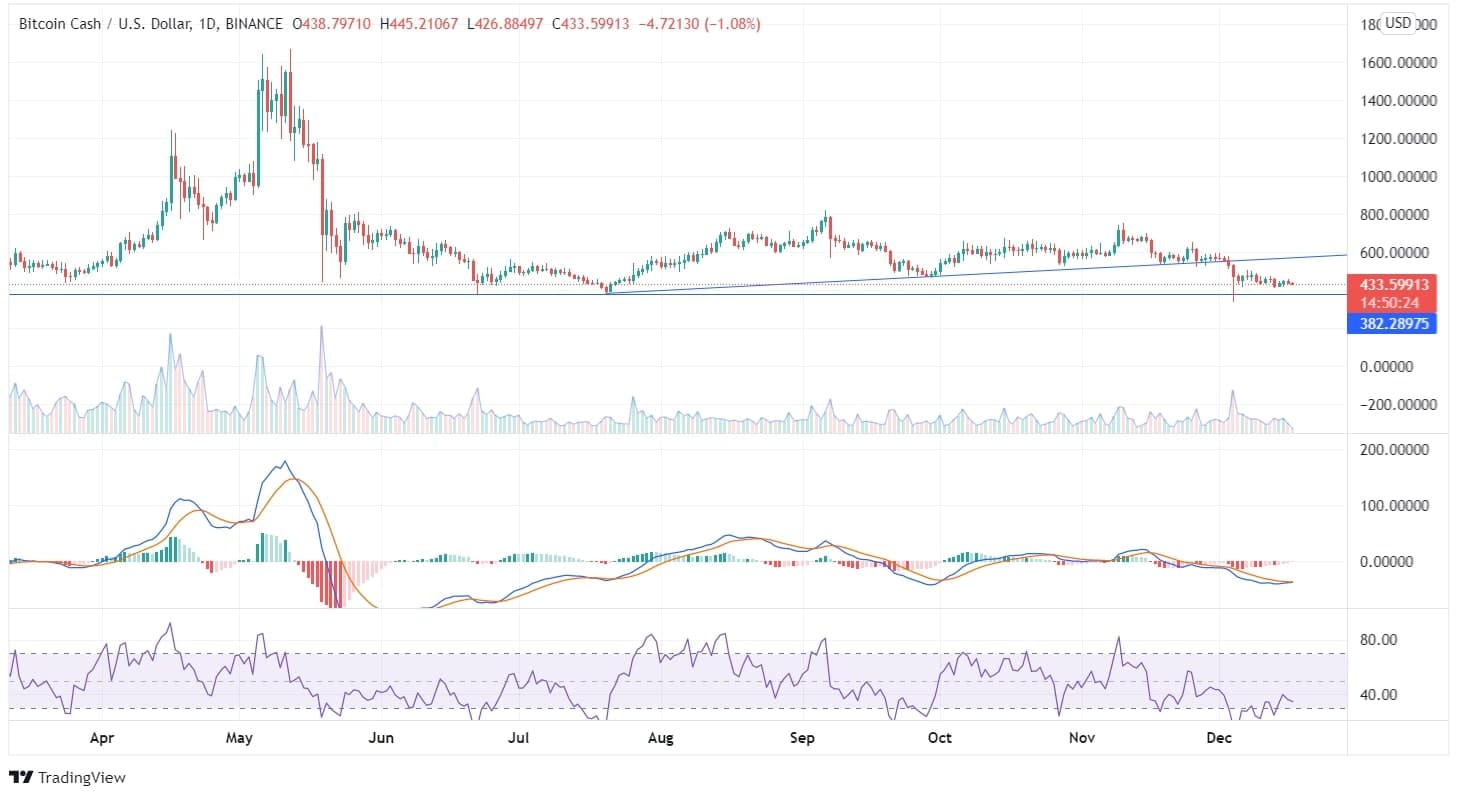
Bitcoin Cash or BCH has given significant returns to its bulls in the first half of the year, and in July, it touched its support zone back. However, the coin recovered later but formed a lower peak at $787. The coin has traversed the up-trend line and has descended to the current price of $434.16.
The price got tested at the support line of $386 on December 4 but failed to suppress the line, and the price slope down further. The price has moved sideways with isolated movement between the trend line and the support line in the past few days.

The RSI being 34 is currently neutral but has recovered from its oversold zone and may head towards its overbought zone. The volume candles are unbiased in between the bulls and bears.
Investors should study the fundamentals as the technical parameters are currently neutral. If the coin recuperates, it may reach its last resistance of $656. However, if the coin breaks the support line and descends further, it may reach $235.
The bulls are trying to push the price up for longer time frame charts. But the bears are taking the price down, and the price is moving in the bearish zone. The coin gave noteworthy returns to its bears in a period of 3 to 4 weeks.
A strong downside momentum can be expected if the coin closes below the support line. If the price uplifts while closing above the up-trending line, an upside momentum can be expected, which may take the coin to its resistance of $820.

