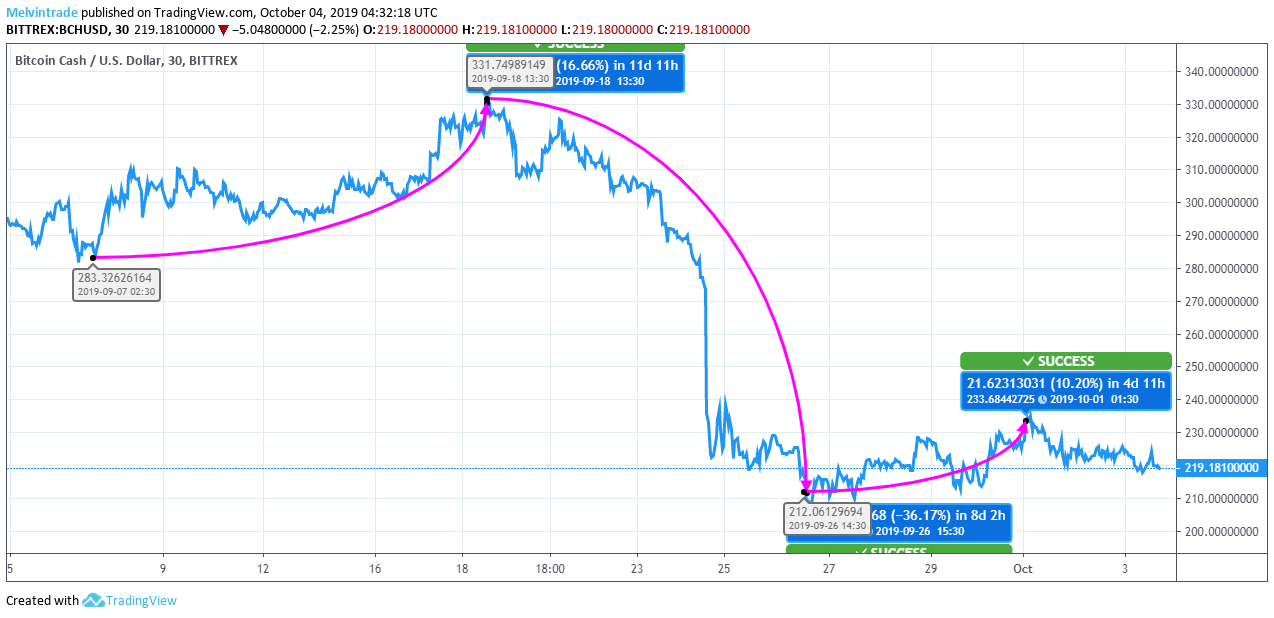
- Bitcoin Cash price plunges due to the ongoing bear sentiment, as seen from the 30-day price chart.
Bitcoin Cash has had a fairly stable run this year until the bears took over the crypto market at the end of June. From then onwards it was a constant downward slide for BCH, as can be seen from the 30-day price chart. The price of BCH has been fluctuating between $212 – $332.
BCH to USD Price Analysis:
The price of BCH had shown a stable momentum during the first fortnight of Sep but fell later due to the continual bear pressure, as seen from the 30-day price chart. From a low of $283.3263 on Sep 07, the price of BCH rose to $331.7499 on Sep 18 showing a good increase of 16.66%. The bears started getting more stronger after this phase and continued to put pressure on the price of BCH, with the price falling to $212.0613 on Sep 26, and the fall was to the tune of a huge 36.17%. The price did recover slightly to the extent of $233.6844 on Oct 01, and the rise is to the tune of 10.20%. The current day’s price is at $219.1810, which is again lower by 6.21%.
BCH had performed fairly on a stable momentum for the most part of this year till the bears got the better of it and started controlling its price. The price is still under the bear grip with continual ups and downs. As per Bitcoin Cash prediction, this bearish phase is expected to continue for the short-term. Analysts feel with the bears still being stronger, the crypto market will take some more time to gain a steady momentum, but BCH price should be able to get back to its normal price range at least by the end of the year.
Long term investors tend to gain if they hold on to the investments for a longer time. Short term and day traders can make gains by timing their investment decisions in a prudent and cautious manner.


