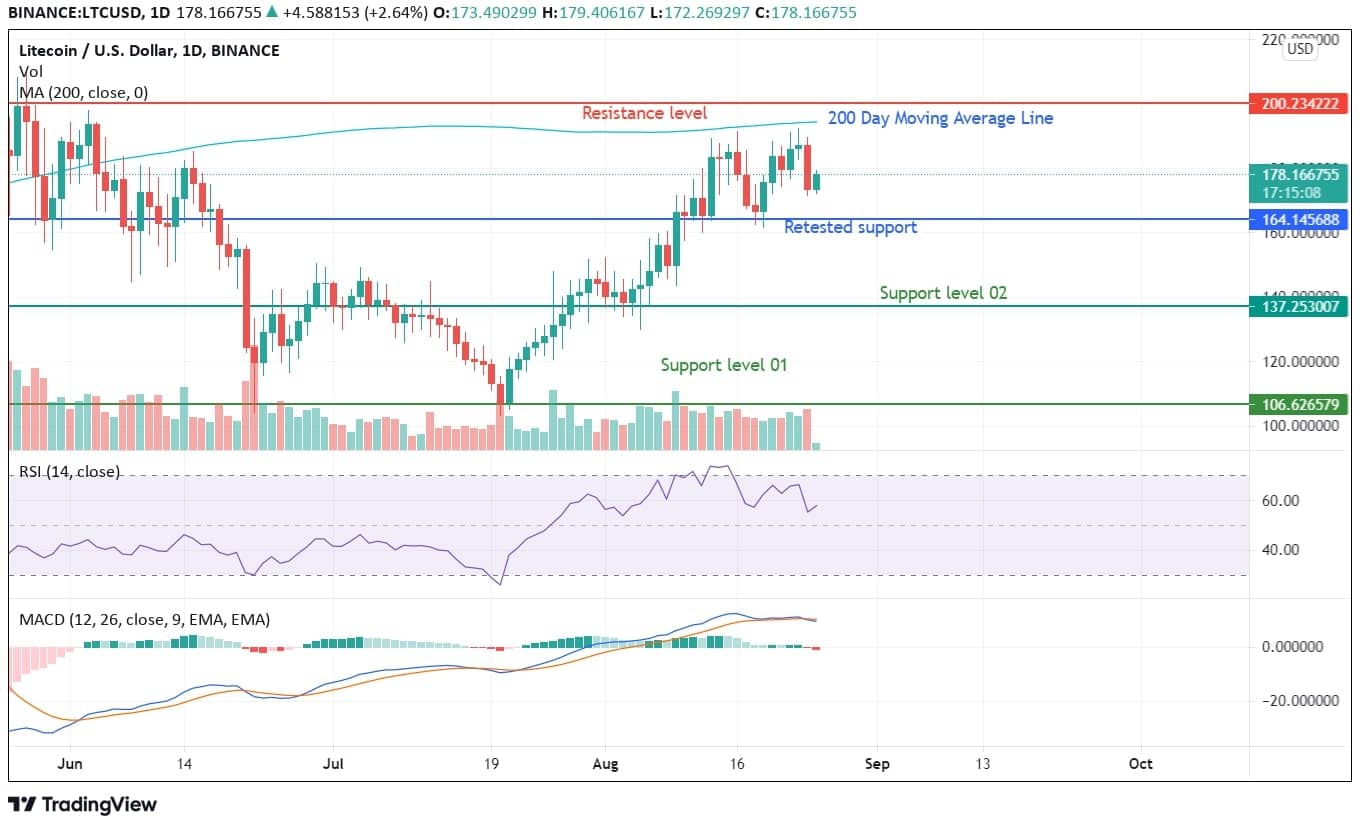
While a majority of cryptocurrencies have breached the low created on May 21, 2021, LTC is still trading below that level. It is one of the worst-performing cryptocurrencies when compared with the blockchains launched before 2015. The resistance at $200 is so high that buyers are also losing interest in buying this asset near the levels.
The sluggishness is caused by the failure of Litecoin to cross its 200-day moving average. Crossing the 200 DMA is the most important aspect for turning Litecoin into positive crypto on long-term charts. There is no doubt that LTC has rallied close to 70%, but when compared to leading cryptos, the rally has taken them above the important resistance levels.
Litecoin Price Analysis
Litecoin has multiple support from the current levels of $178, but the fact that it is trading below its historical moving average of 200 Days makes it a double-edged sword. On the one hand, where LTC price can trade above its 200 DMA with a 20 – 30% gap, it can also initiate a sell-off from the 200 DMA levels. Hence, crossing $194 levels in the current rally seems a bit tough.
A new rally and positive swing after retracing a bit lower can be helpful with renewed buying interest. However, one should not underestimate that it is trading too close to its 200 DMA and can breach it with just a 15 – 20% of upside rally. On an indicative front, MACD creates a bearish divergence signifying a higher probability of profit booking and selling pressure, with supports lurking at $164, $137, and $110 levels on the downside.
RSI is in the range above 50 and has bounced back towards overbought zones on daily charts, indicating a superior buying sentiment and interest around the RSI levels of 55. On a positive note, Litecoin has been respecting its 34-degree upside rally without any breaches and has taken swing supports from the trend line without facing difficulty.


