BNB has witnessed an outstanding run in 2021. Since the fall in May 2021, there have been some strong headwinds, which are stalling the further progression of BNB. The price has been declining since the beginning of June and has been falling from the high of $432.
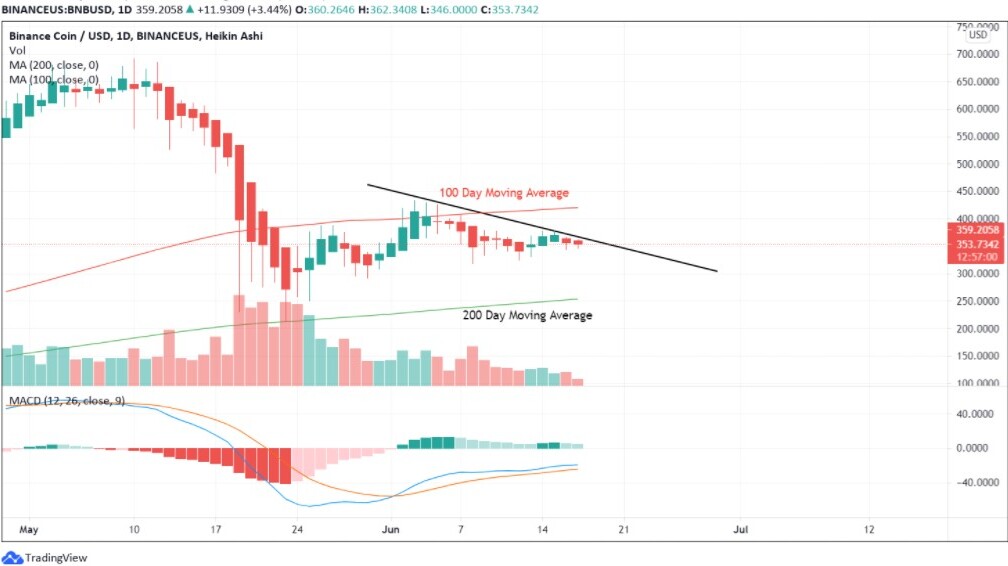
BNB dipped to the lows of $318 and retouched at a slightly higher price of $377. Still, the price action seems to be capped at the higher end. Apart from this to analyze the future of this currency you can check forecasts and latest news on Binance coin in detail. Although for now, let us take the technical route and deduce the breakout possibilities in the price action. Its trend line seems to be quite weak, and a close above the line could only indicate a buying scenario in the longer run.
BNB Technical Analysis

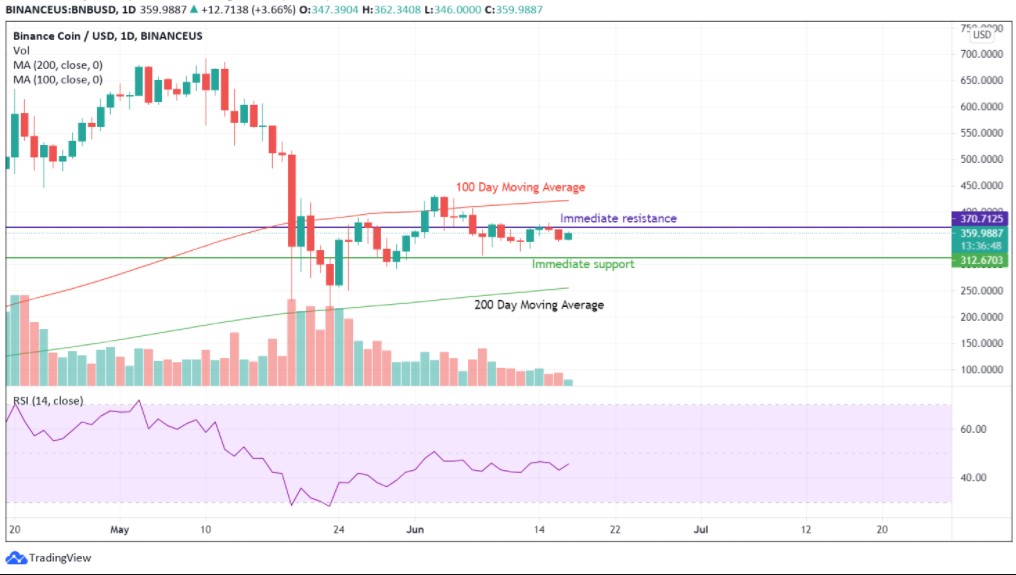
Immediate Resistance: $365 – $375
Immediate Support: $310 – $320
100 Day Moving Average: $422
200 Day Moving Average: $254
We will be using moving averages, trend lines, immediate support, and resistances to determine the price action and further potential in BNB. The beginning of this month bears a spectacular rally of over 30%, but the resistance and lack of buying sentiment brought BNB back to the previous lows of the $300 range. Currently, it has been trading close to the resistance zone of $365 to $375, which has essentially capped the upside momentum.
While BNB is trading way above the 200-day moving average, it is also far from reaching the 100-day moving average. Moreover, trading in a small consolidation zone indicates that there is a lack of decisive action on both sides. The future of Binance coin seems bright only because of the rise in trading volumes and new crypto trading accounts. Trading close to the resistance lines creates a possibility of breakout that can push BNB back above the $400 levels.
The larger resistance would be faced in crossing the 100-day moving average and will be a deciding factor in the further price action in BNB.

Heikin Ashi provides a clear picture of the market sentiment on different time slots; on the daily chart, we can witness the prominence of the same trend line. Thus, any short-term rise cannot be considered a positive momentum until it creates a green candle on Heikin Ashi charts. While these candles are not exactly a replica of normal candles, the price is derived from a mathematical formula using the last chart.
Only the solid candles with one side wick are considered while evaluating the market sentiment. BNB has so far failed to provide clear green candles since 15th June. Hence sentimental traders should not make a market entry at this point, but any momentum will first trend in normal patterns. So traders and investors can take cognizance of both the chart patterns before deciding their moves.
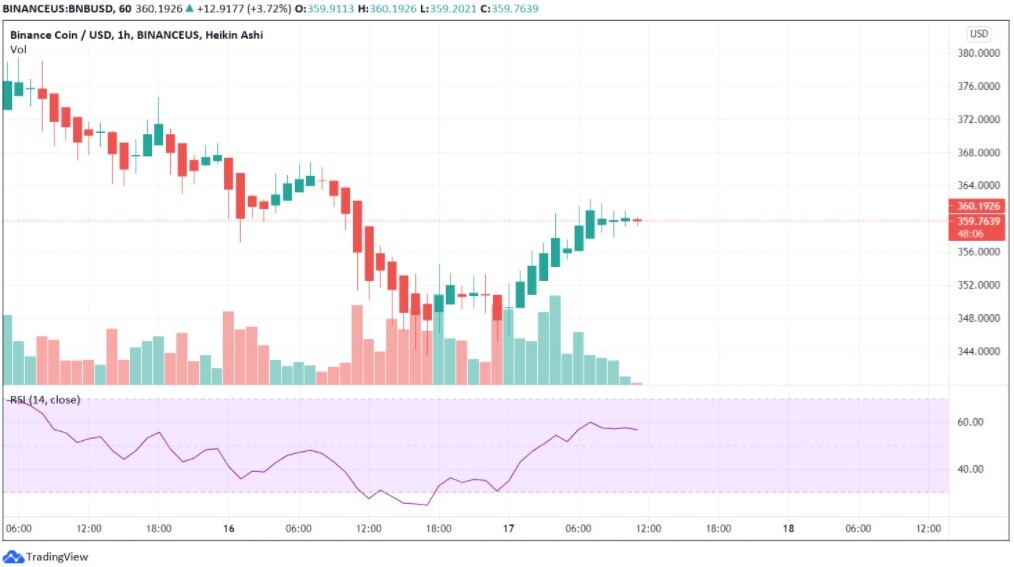
MACD is also indicating a similar trend with lower green side histograms. Therefore, for a shorter time frame, we will be analyzing the price action on hourly charts.

On hourly charts, BNB shows some strength and upside movement taken from the $340 levels. The upside movement has broken the two-day downtrend and pushed some new excitement into the crypto traders. However, the last three or four hours have been indecisive, which shows that BNB has reached the climax of its short-term rally.
The histogram levels of 57 on RSI indicate closing towards the overbought zones, which poses itself as a positive sentiment.

