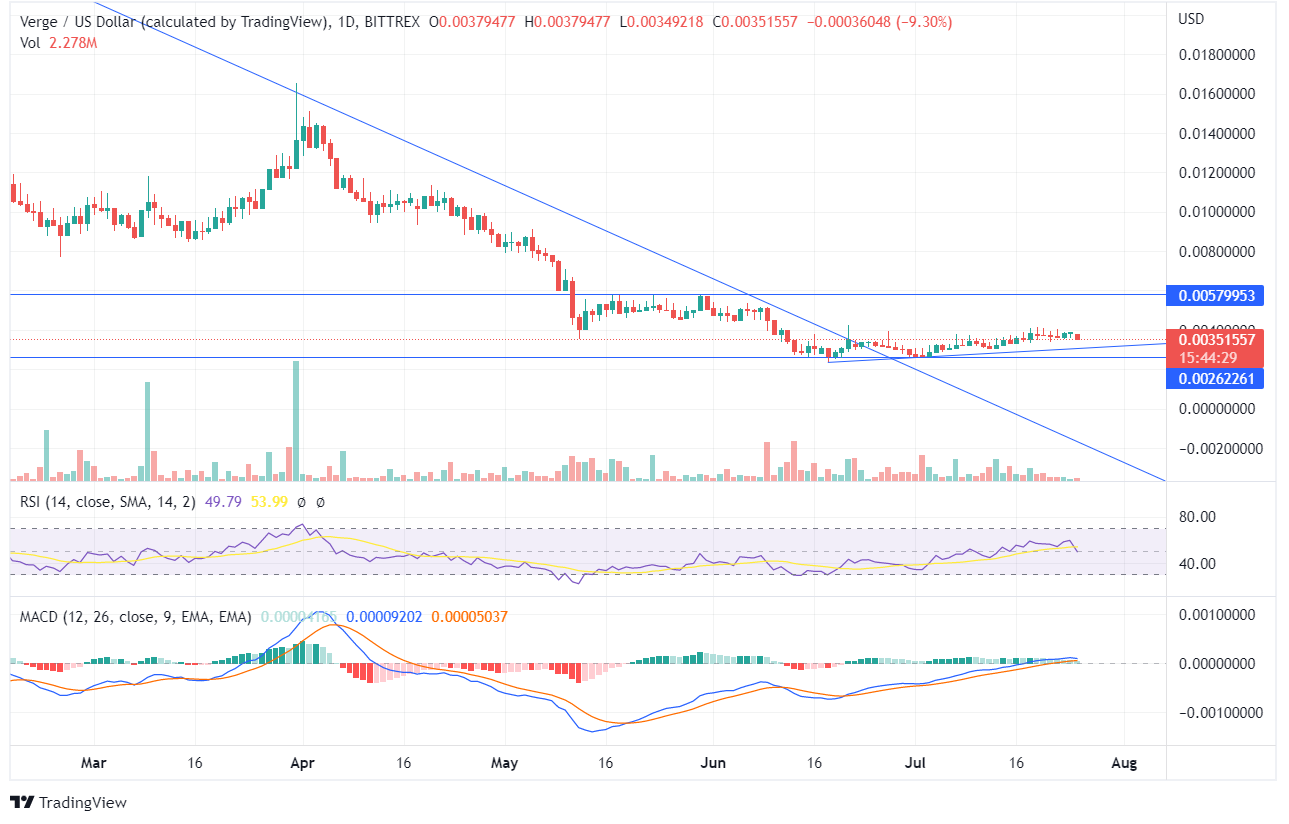
Verge (XVG) has been moving sideways in consolidated momentum, showing almost no price movement with the current market price of $0.0035. The price of Verge has been caged in a horizontal bounded price range of $0.005 and $0.002 as there is indecisiveness in the XVG price movement.
As per the below price chart, we can see the perfect correlation between the XVG price and the RSI indicator. The price was moving below the downtrend line; however, since July, the Verge coin price suppressed the trend line and moved upwards. If the price continues to ascend towards its previous resistance of $0.005, the coin may begin a bull run.
XVG entered the oversold zone in May, and while the price continued to fall in June, the token didn’t touch the oversold zone, rejecting any further downfall. The RSI indicator is at 49 and shows neutral price movement; once the price moves in a particular direction, future price action can be predicted.
The MACD line is ahead of the signal line by a small distance, and the histogram shows declining green candles. The investors should wait for the forming candles and for the MACD to confirm a trade indication. The forming bearish candle shows the price falling towards the trend line, creating a lot of confusion for Verge traders.
On the weekly chart, the XVG candlesticks are moving upside taking the support of the up-trend line. The last week’s candle reveals a significant upward move, thus being a gainful week for the Verge investors.
The weekly candlesticks ascending can be an opportunity for the bulls in the long run as the price of XVG turns from its lower lows, and the last 3 weeks’ candles created higher highs. The technical parameters are neutral currently but may show an upside momentum in the coming days.


