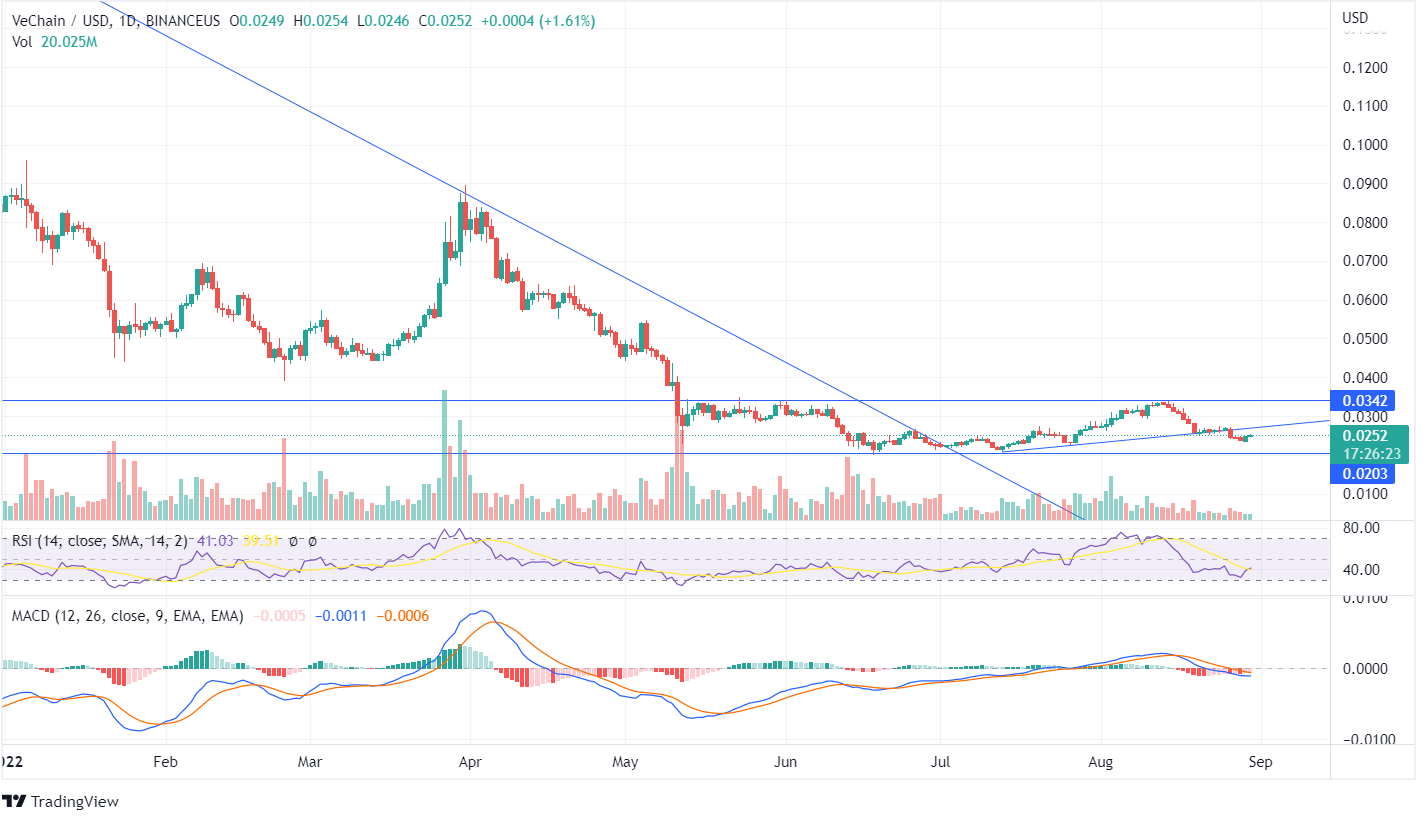
VeChain moves sideways between the price range of $0.0342 and $0.0203 with the current market price of $0.0252. The VET token has been moving below the long extending downtrend line, and recently the price moved outside the trend line but couldn’t close above the high of $0.0342.
There was a formation of a bearish engulfing pattern on the daily chart. A decline in the price of VeChain can be expected towards its support. The bearish candle formed on August 26 shows that the VET price may close below the up-trend line indicating a rejection for the token’s upliftment. Before investing in the coin, read our VeChain price prediction!
The RSI indicator had entered the overbought zone, and the indicator at 41 shows neutral price action. However, the indicator line tilting downwards shows the price may trend downside. The MACD line is below the Signal Line, and the histogram showing red candles denotes the price may decline towards its lows. The token has already seen a significant price reduction from when the MACD gave a bearish signal.
The forming bullish candle on the weekly candle shows a rise in the price. However, once the VET price closes above the trend line, a bullish momentum can be confirmed. The previous week’s bearish candle closing below the trend line shows a huge decline.
The long-term investors should wait for the forming candles as the price shows consolidated momentum and the VeChain indicators are neutral. Strong price action can be expected once the price closes above the resistance or below the support line in the long run. The bearish engulfing pattern formed at the peak indicated the decline towards its support point.


