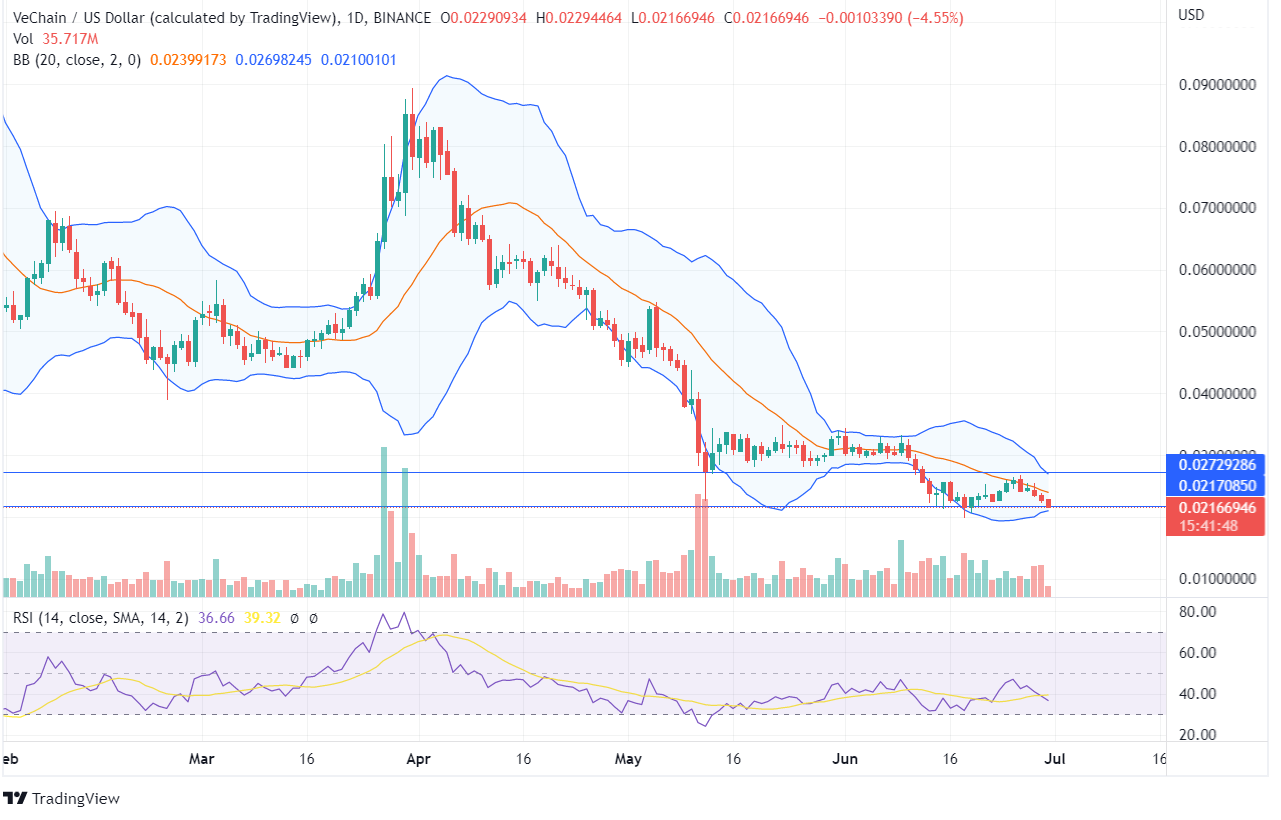
VeChain has been a bearish token for the past few weeks as the price fell from its highs of $0.089 in the past 3 months to the current price of $0.021. The price has been moving on the support line of $0.0.021. For the past 3 weeks, there has been less volatility in the market as neither the bears nor the bulls could take the VeChain price in any direction creating indecision for the investors.
The previous week’s candle shows that bulls tried to push the price but faced rejection for an uptrend. Since then, VET has been moving sideways. On June 18, the coin reached its 52-week low of $0.021; however, the forming candles haven’t closed below it. On June 29, there was again a marginal price movement in favor of bears.
On the daily chart, the VET price is moving parallel between the price range of $0.027 and $0.021. The VeChain price was moving at the edges of the lower Bolinger Band and faced rejection for the further downfall. However, the VET price is moving between the Bollinger Bands and may head towards the lower Bollinger Band.
The RSI indicator is at 36, shows neutrality, and the upcoming price action depends on the forming candlesticks. There was a formation of a bearish engulfing pattern on June 26, after which the token reduced significantly. Once the VET price closes below the recent low of $0.019, a downtrend pattern can be expected.


