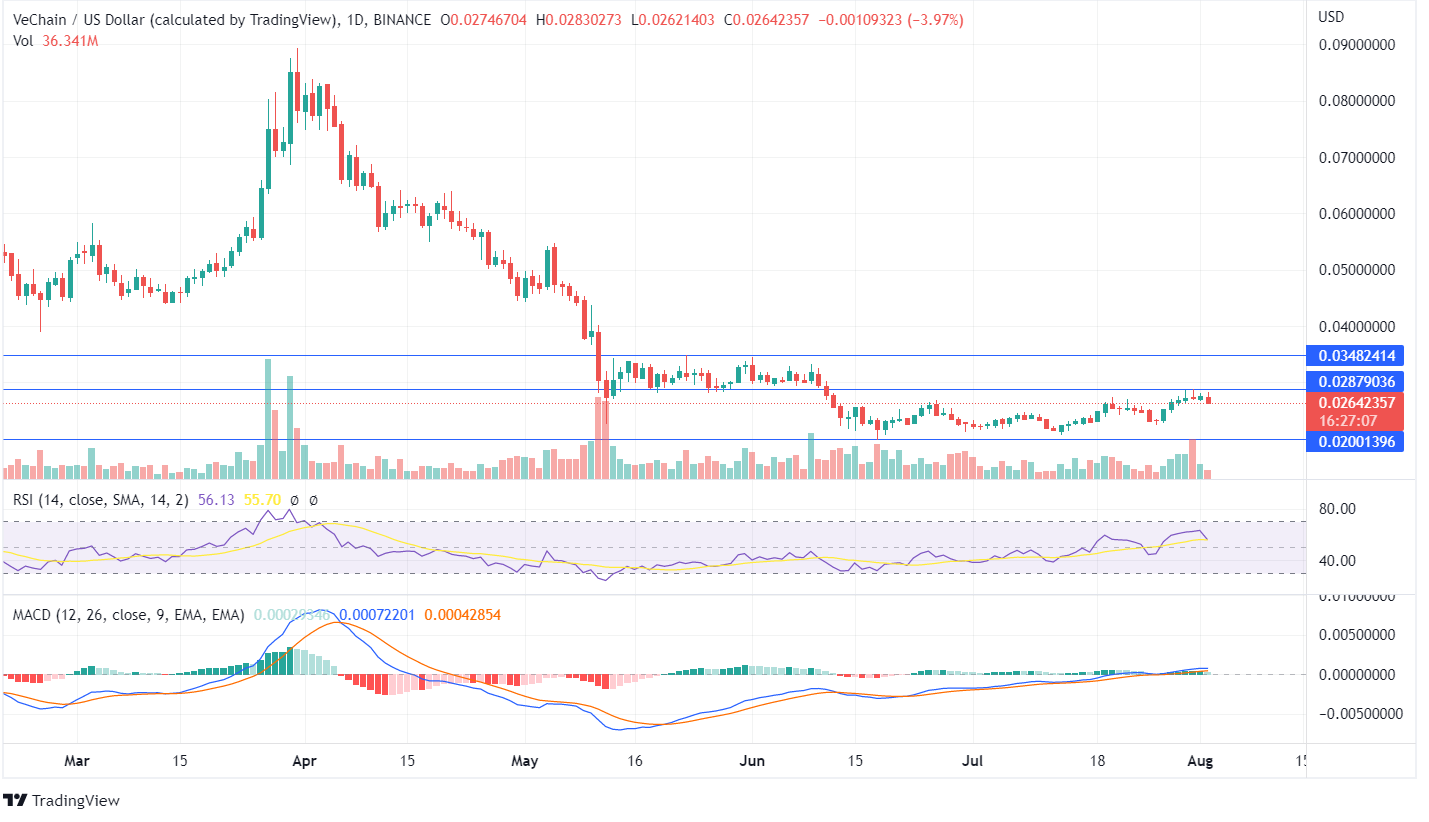
VeChain has been caged between the horizontal bounded channel and shows consolidated momentum as the token dropped from its highs of $0.089. The VET token has been revolving around the support zone for the past few days, as the price is moving between $0.028 and $0.020. Neither the bulls nor the bears are able to push the VET crypto price in any direction, thus forming indecision in the market.
The VeChain price has crossed the recent highs of $0.027 but is yet close above it. Once the bulls put buying pressure and show demand for the VET token, an uptrend pattern can be expected.
The MACD line is ahead of the signal line but with a minor price gap, and the histogram shows diminishing green candles. Once the price closes above the low peaks, bulls can have an opportunity. Read VeChain predictions to know in which direction the price will go!
The RSI is 56 and shows neutral price movement; however, the RSI line has tilted downwards and may head towards lows if the VET price continues to decline. The volume bar shows remote price movement, but there was supportive volume for bears on July 31, when the price hit the horizontal line of $0.028. Since then, there has been a noticeable decline in the VeChain price.
On the weekly chart, the VeChain has moved significantly. A turnaround cup pattern formed at the support zone shows the bulls are trying to push the price upside. However, remote price movement indicates there is a requirement for additional buyers.
The traders should wait for the upcoming price action as the indicators are currently neutral. Once the price closes above the horizontal line, a bullish trade can be expected, or if the VET price closes below the support line, a bearish trade can be expected.


