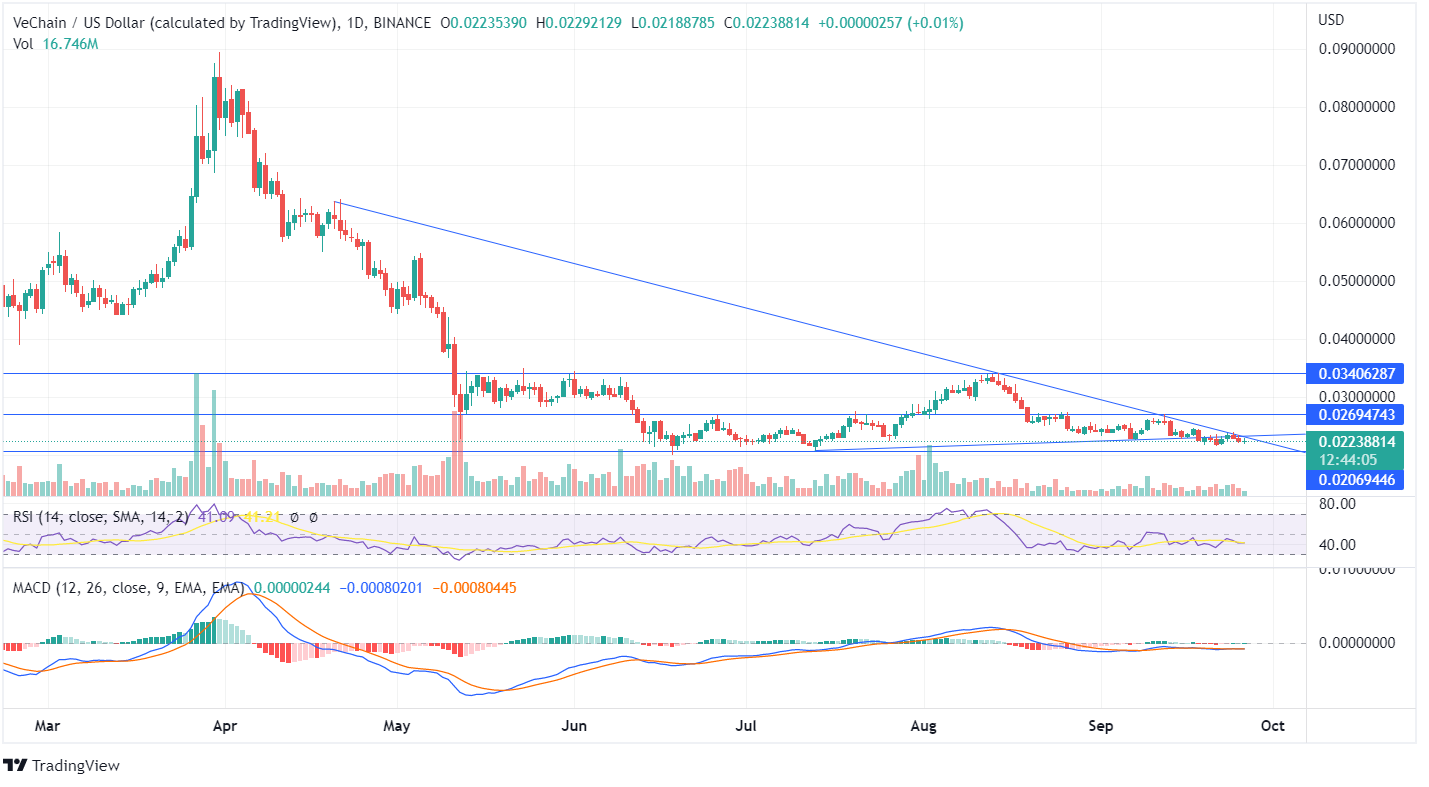
Vechain has been moving below the downtrend line at its lows with the current market price of $0.0223. The token has been moving between the horizontal price range and remote price movement. The forming candle of VET is getting tested at the trend line, and the price is yet to close above the trend line for upside momentum.
On September 25, the VET coin declined marginally. The forming candle shows that though the bulls are trying to push the price of the Vechain high, it is yet to close above the previous day’s high. The price was moving above the up-trend; however, the recent candles moving below the trend line show a requirement of additional buyers for an upside move. Check our Vechain prediction to know if there will be more buyers or not!
The MACD line and the Signal line overlap each other with diminishing candles, thus indicating neutral price action. Once the VET price suppresses the trend line and closes above it, it may head towards $0.026, and if the price of Vechain closes above $0.026, the token may further head towards the resistance point of $0.034. The RSI indicator is 41, shows neutral price movement, and the bulls need to show a positive move to form bullish candles.
In the weekly chart of Vechain, the previous week’s candle was moving at the edges of the downtrend line, and though the bulls tried to close the price near its highs but couldn’t close. There was a marginal price movement, but the formation of Dogi shows that both bulls and bears could take a major price action.
The forming bearish candle moves below the uptrend line, and the VET price may reach its support line of $0.020, from where the token may turn around or may decline further. Though the indicators on the weekly chart of Vechain are in the bullish zone, the price needs to close above the up-trend line to confirm bullish momentum.


