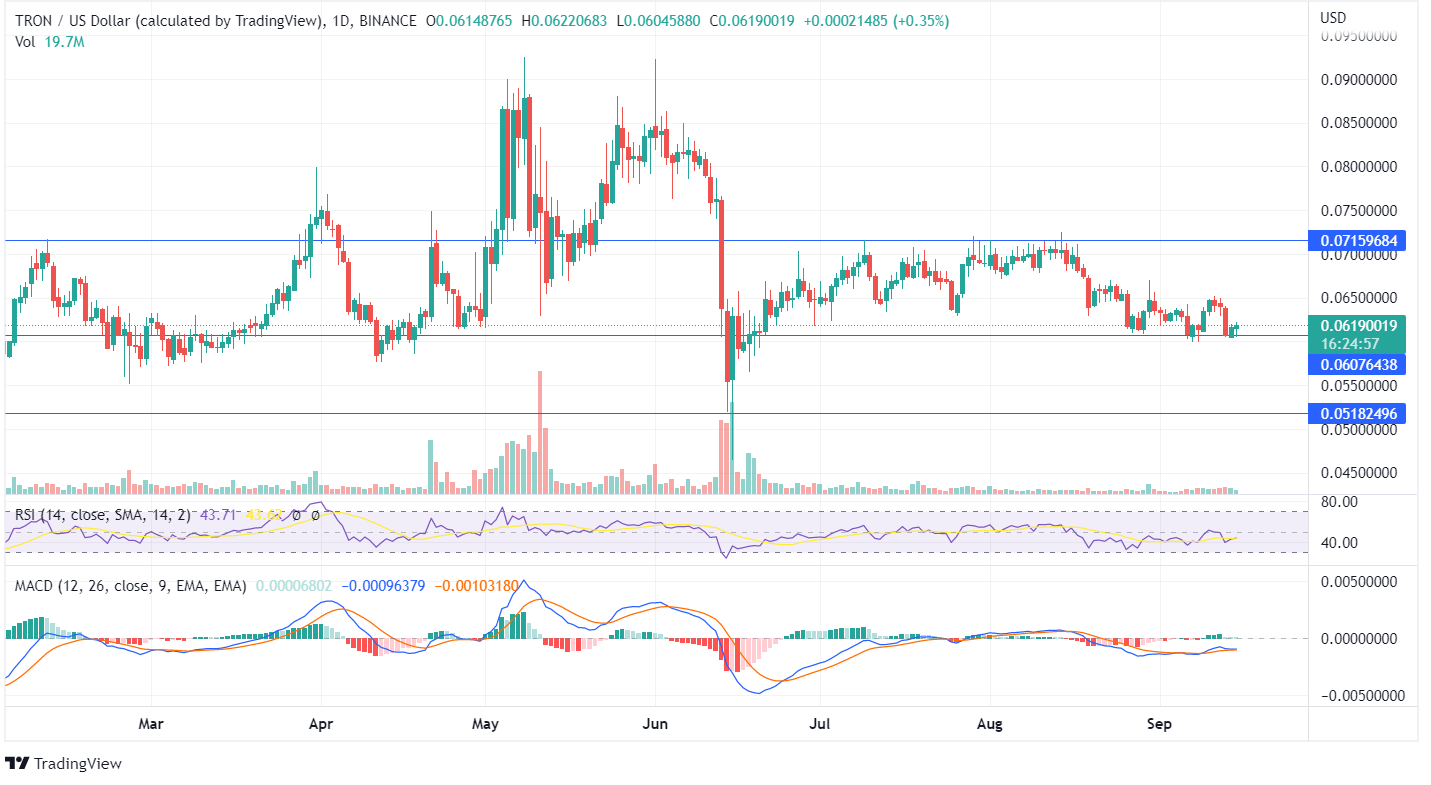
TRON moves sideways as the price turns from its lower zone with the current trade value of $0.0619. TRX coin has been showing consolidated momentum with little movement in its price. The token has been moving between $0.071 and $0.060 for the past few weeks. This indicates that the bulls or bears are unable to close the price above or below the resistance or support line.
The formation of bullish candles as the price turns from its lows shows the TRX token may head towards its resistance point of $0.071 in the upcoming days. TRON shows a downtrend pattern due to the formation of lower lows, and the price of TRX hasn’t yet closed above the recent highs.
The RSI indicator is at 43, which indicates neutral action, and the indicator moving sideways shows indecision. If the bulls push the price of TRON towards its resistance, the RSI may enter the overbought region. The MACD and Signal Line overlap with diminishing candles in the histogram, thus indicating neutral price movement.
There is a requirement for additional buyers for the TRX price to move in an upward direction. The volume bars are below average, suggesting the failure of both bears and bulls to push the price of TRON in any direction actively. Read our TRX price prediction to know when will this consolidation end.
On the weekly timeframe, the forming bearish candlesticks show a fall in the price with a marginal reduction. The weekly candle is yet to close above the previous highs or previous lows and is moving sideways to show neutral price action.
The technical parameters are currently bearish in the weekly chart. Investors, in the long run, must wait for the forming candlesticks before investing in TRON, as currently, it shows a bearish trend, and the daily chart is neutral.
The aggressive investors may study the fundamentals for the short term. If the TRX price continues to fall and closes below the support line of $0.060, a strong bearish trend can be anticipated in the long run.


