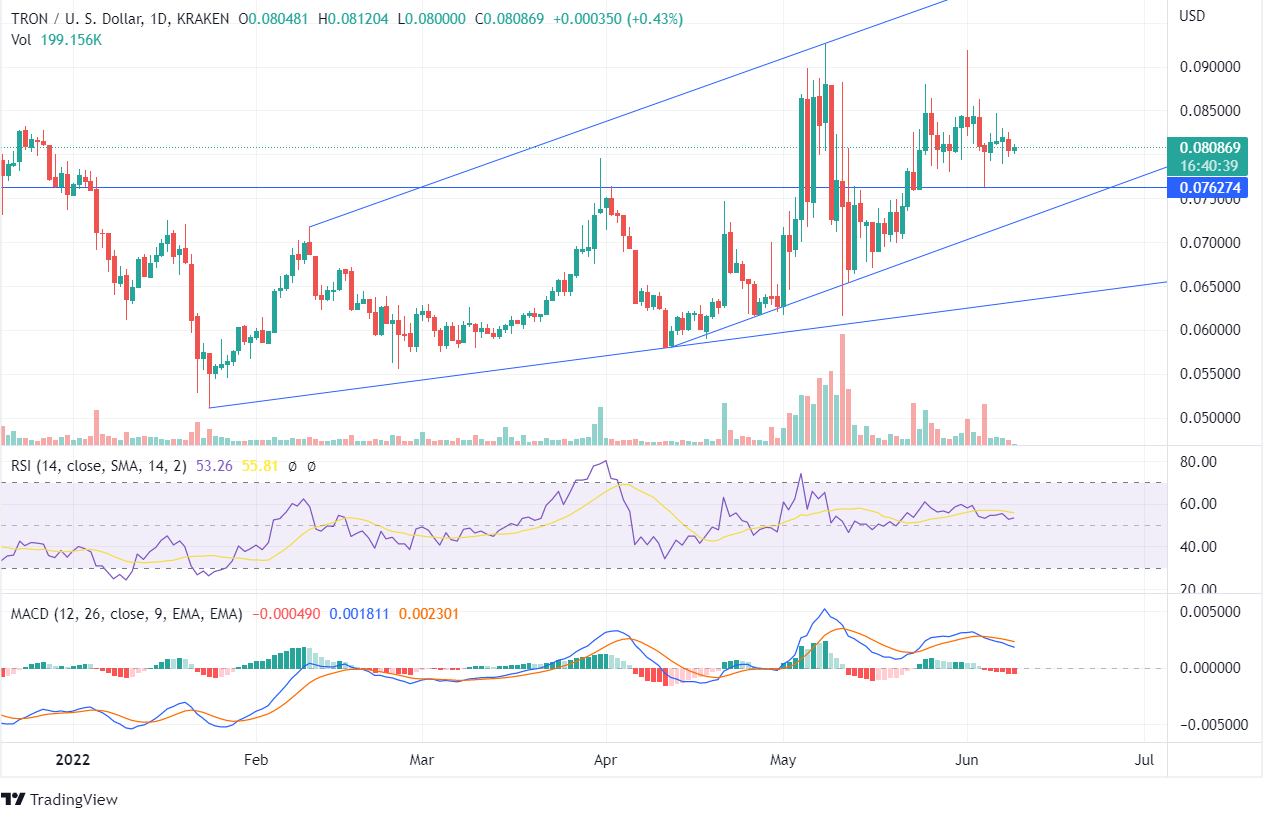
TRON has begun to move in ascending pattern as the price turns from the low of $0.061. The token is currently moving sideways on the daily chart with a price of $0.080. On June 08, there was a slight decline in the TRX price, and the volume bar favored the bears. However, the TRX price showing rejection of the downfall can be an opportunity for bulls.
If the TRX price constantly falls and closes below $0.0.076, it may take the support of the trend line for an upcoming hike in the price. The previously formed candles show that bears and bulls both tried to push the price in their favor but couldn’t, creating a slight price movement and forming indecisiveness.
The MACD line is moving below the Signal Line, and the red candles on the histogram indicate a bullish momentum. The daily chart is not supportive of the coin, and it is advisable to read the TRON prediction before making the investment decision.
A bullish opportunity can be expected once the price closes above the immediate resistance. The RSI is at 54, indicating neutral momentum as the candles move sideways. The bulls should put buying pressure and close the price above the previous day’s high.
The weekly chart shows the formation of bullish candles from the past 3 weeks, and the forming bearish candle shows that the bears are unable to push the price downward. The TRON price is moving in between the channels, and once the price suppresses the channel line in any direction, a robust momentum can be expected in the long run.
The indicators in the long time-frame chart show a bullish trend. The weekly candle formed on May 09 shows a significant decline, after which the price didn’t reduce further, and an ascending candle was formed, which could be a trading opportunity for the bulls.
However, as the other cryptos are in a downfall zone, the investors should investigate the fundamentals before buying the asset. If the TRX price continues to fall, it may even reach its support line of $0.061.


