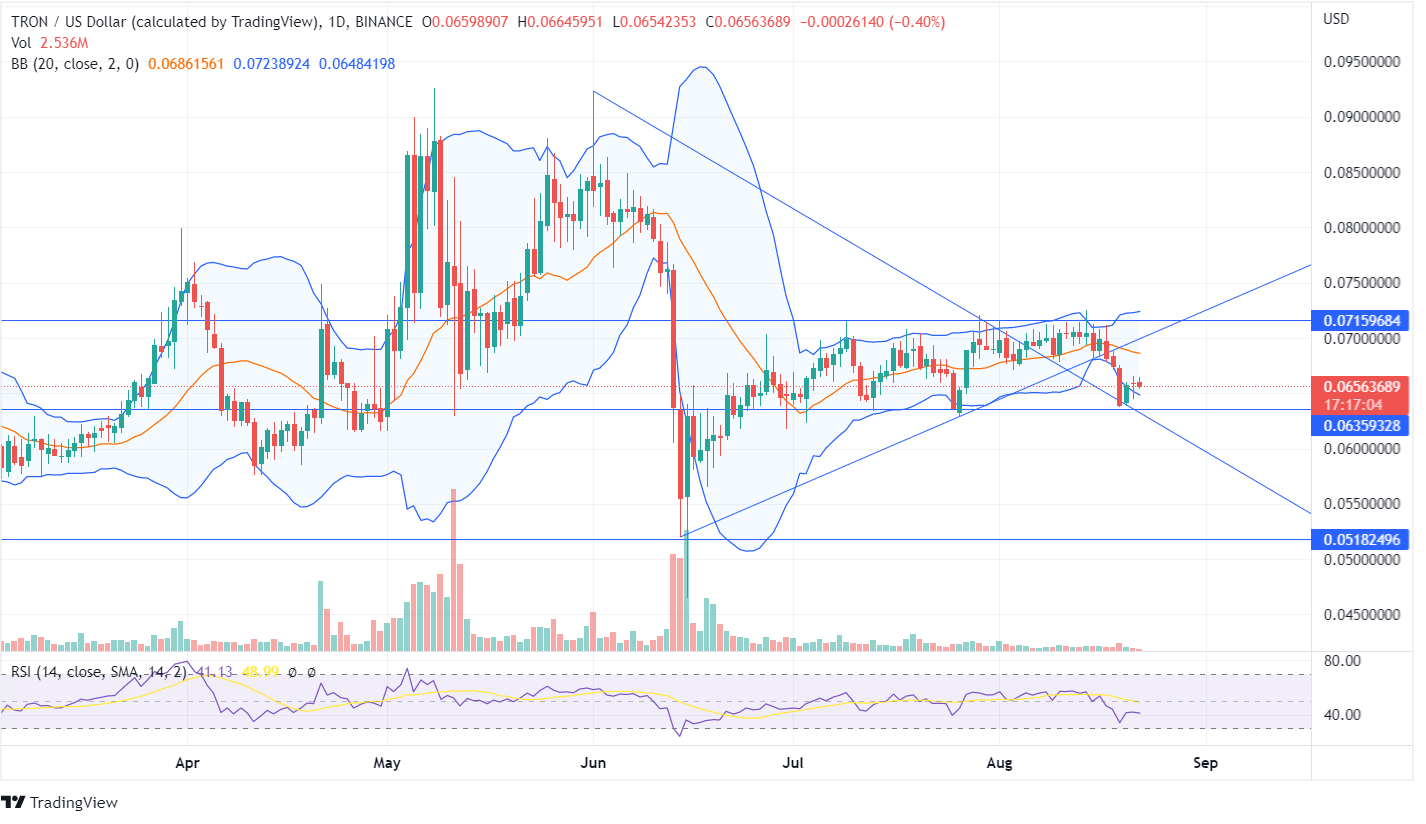
TRON shows sideways momentum as the price has been moving between $0.71 and $0.63. Yesterday, the bulls and the bears pushed the price in both directions but failed to close above or below the high and low forming indecision about the upcoming price action.
The TRON token turning from the bottom horizontal line of $0.063, may head towards the top horizontal line of $0.071 as, during the past few days, the TRX price has been fluctuating between the lines. The bulls in the last days tried several times to push the price upside, breaking the near resistance of $0.071 but failed to ascend and inclined back towards its lows.
The Bollinger Bands being close to each other shows less volatility in the market. The TRX price revolves around the lower bands, and the price closing below the bands may push down the price further. The TRON volume bars moving below average show unfavorable support towards bulls or bears.
The RSI indicator is at 41 and is moving sideways, showing neutral price action. The TRON price was taking the support of the up-trend line and was moving upside. However, on August 17, the price traversed the trend line, and price declined marginally. Read our TRX price prediction to know if you should hold the coin or not!
During the last week, the TRX token showed a remarkable decline. The last few weekly candles show prices moving in a parallel range without any major price action in any of the directions.
The traders should wait for the forming candles as the TRX price may break the horizontal lines in any direction and close above or below it. The current scenario shows indecision in the market as the forming bearish candle shows remote price movement.


