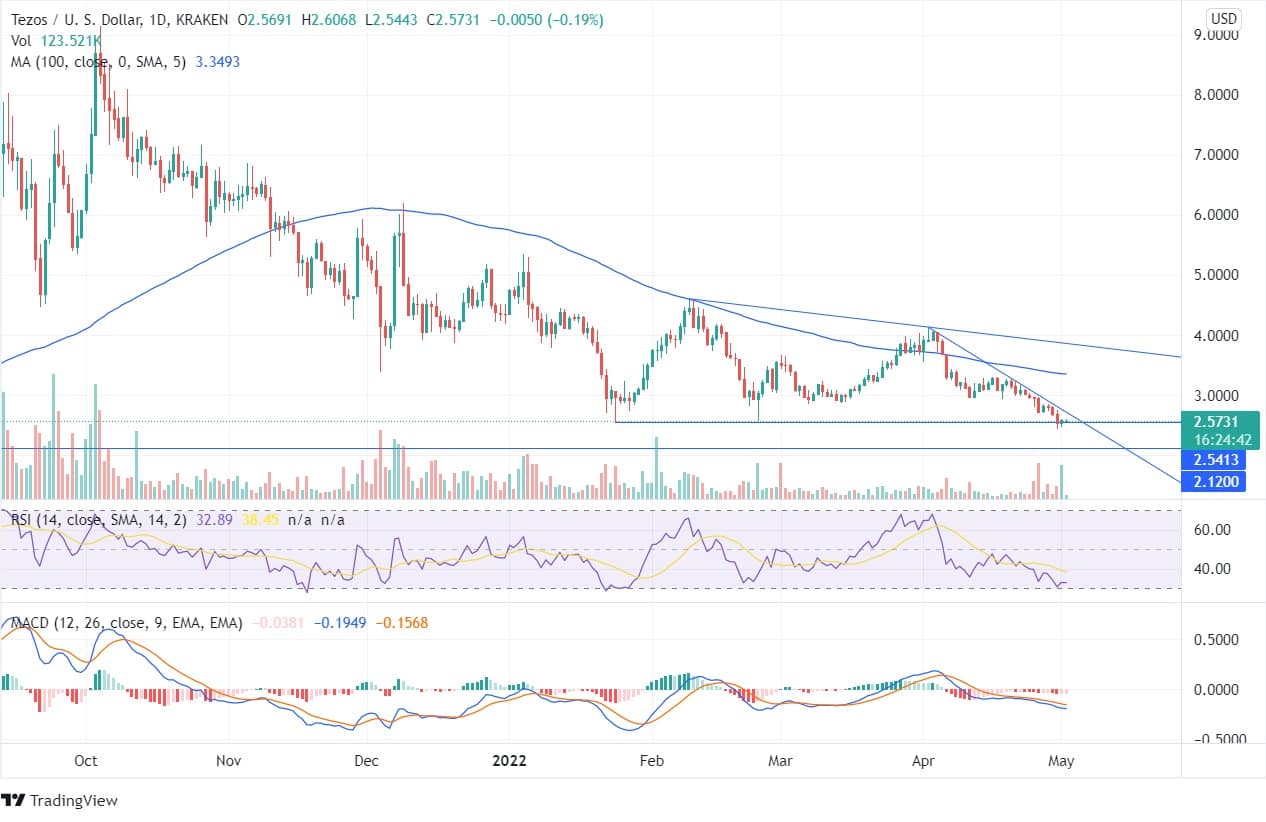
Tezos (XTZ) is moving in a downtrend pattern, forming lower low peaks with the current market price of $2.58. On the weekly chart, the token shows the formation of bearish candles from the previous four weeks, and the coin declined by 66%. The forming weekly candle shows a turnaround from a crucial support zone as the price hasn’t closed below it in the last 1.5 years.
The previous week’s bearish candle had a support volume, but still, the XTZ price couldn’t reduce further, and the bullish candle is being formed, which can be a trading opportunity for bullish investors. The coin is on its way to reaching the lower lows as on the weekly chart; there is favorable volume towards a bearish move. During an intraday session in the previous week, the price of Tezos fell 21%.
On the daily chart, the XTZ coin moves at the edges of the downtrend line while the price is evolving at the support line. Tezos price projects a further fall towards the bottom horizontal line of $2.10. A bullish momentum can be expected if the XTZ price closes above the downtrend line or take a U-turn from the support zone. At $2.10, there is a durable bullish opportunity as the token has mounted from the same level.
Tezos price is moving below the 100-period moving average after being rejected for the ascent. The RSI indicator is 31 may head towards the oversold zone currently, after which the bulls may push the price upwards. The MACD line below the signal shows the coin has already been reduced significantly.
The bears who are already in the trade can wait for the token to reach $2.1, and the bulls looking for an opportunity can expect to enter once the price closes above the downtrend line and the price cracks towards peaks.
The forming daily candle shows that though the volume is in favor of bulls still, the XTZ price is unable to move to climb up. Tezos is currently facing rejection at the support line may fail for an ascent currently towards highs. However, in the long run, a bullish trend can be expected.


