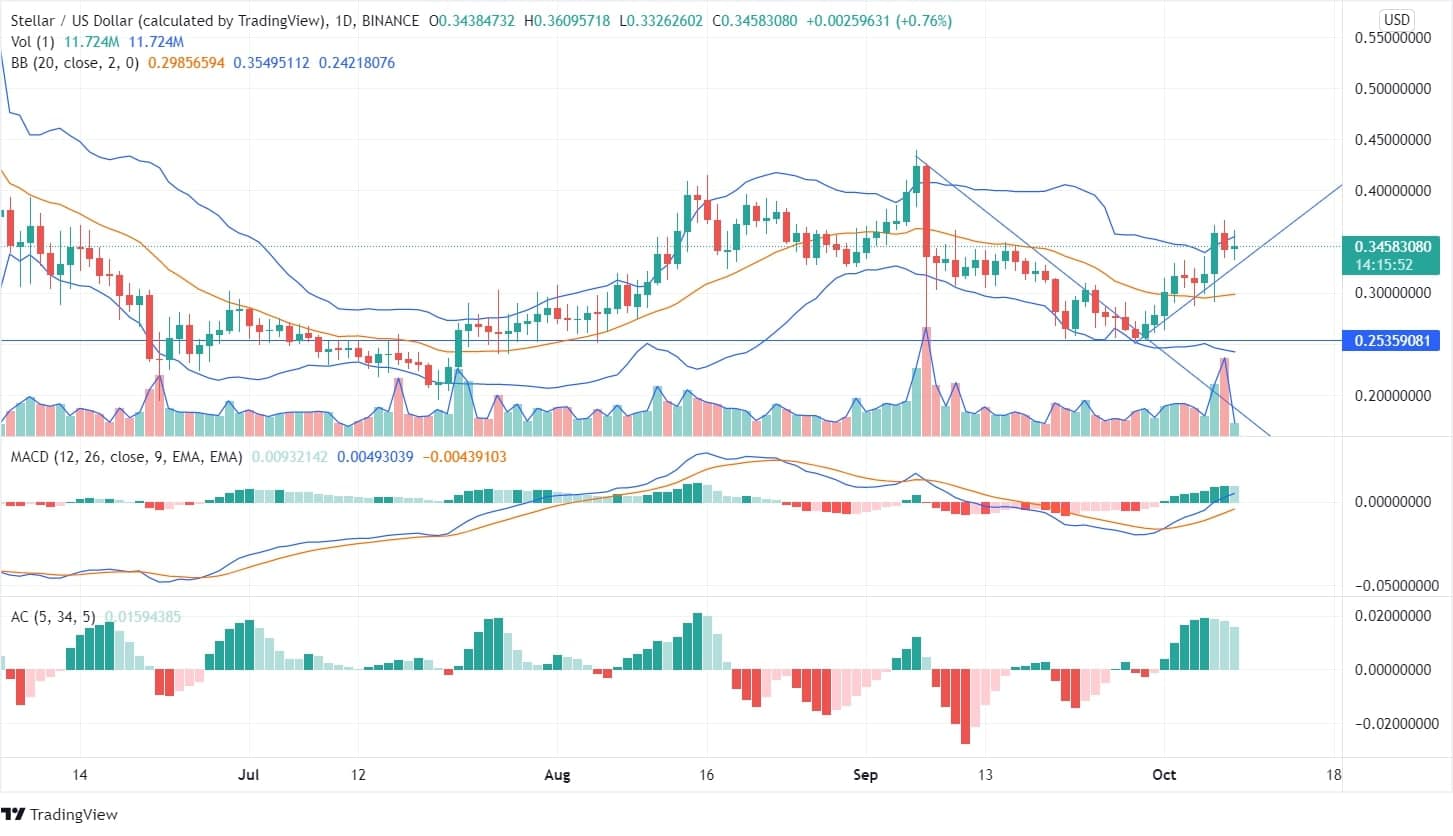
Stellar has been making headlines recently over the news of the Stellar Foundation partnering with Moneygram to develop its ecosystem for CBDC issuance. XLM has seen good buying interests on the backdrop of fundamental prospects of the script. The last two weeks have seen prices surge more than 40%. The small rally had both intrinsic and technical reasons behind it. Observations on the weekly chart reveal that prices have taken support from an upward sloping trendline originating from the lows of the end of December 2020.
While resistance is being indicated immediately around $0.34 to $0.35, by a downward trendline on the same chart, noting the positive sentiment and fundamental views surrounding XLM, the emerging blockchain player is an exciting prospect to invest in once prices see a breakout and daily closing over $0.37. Near-term targets would be the last highs of $0.4317 seen on September 06, 2021, a break of which would open up the counter to huge upside potential with targets as high as $0.80.

The bullish candlesticks formed from October 05 onwards have overlapped the downtrend line from September 06, 2021, making an upside price momentum. On September 28, the bullish engulfing pattern was formed at the same point where the price traversed the downtrend line, and there was an augment in the price from $0.253 to $0.371 in around ten days. The MACD line being above the signal line and with green candlesticks in the daily histogram chart indicates an uptrend move of stellar price prediction.
The Bollinger bands are not much broad, thus indicating that the market is not volatile and there is not much price movement in the coin. There is indecision in the market as visible from the consolidation of prices. The accelerator oscillator shows bullish divergence, which may lead to upliftment of candlesticks and providing returns to bullish investors.
In the 4-hour chart, there is Doji, a transitional candlestick formation signifying indecision between bulls and bears at the resistance zone. The price is continuously following the up-trending line in the 4-hour chart along with a strong bullish divergence.
However, there is not much volume in favor of bulls or bears, so there can be move-in on either side. MACD is below the signal line and red candles in its histogram chart support the bullish move, and the volume candlesticks are in declining order, thus indicating a downward price movement for a short time frame.
However, in the long term market appears to make a bullish move.

