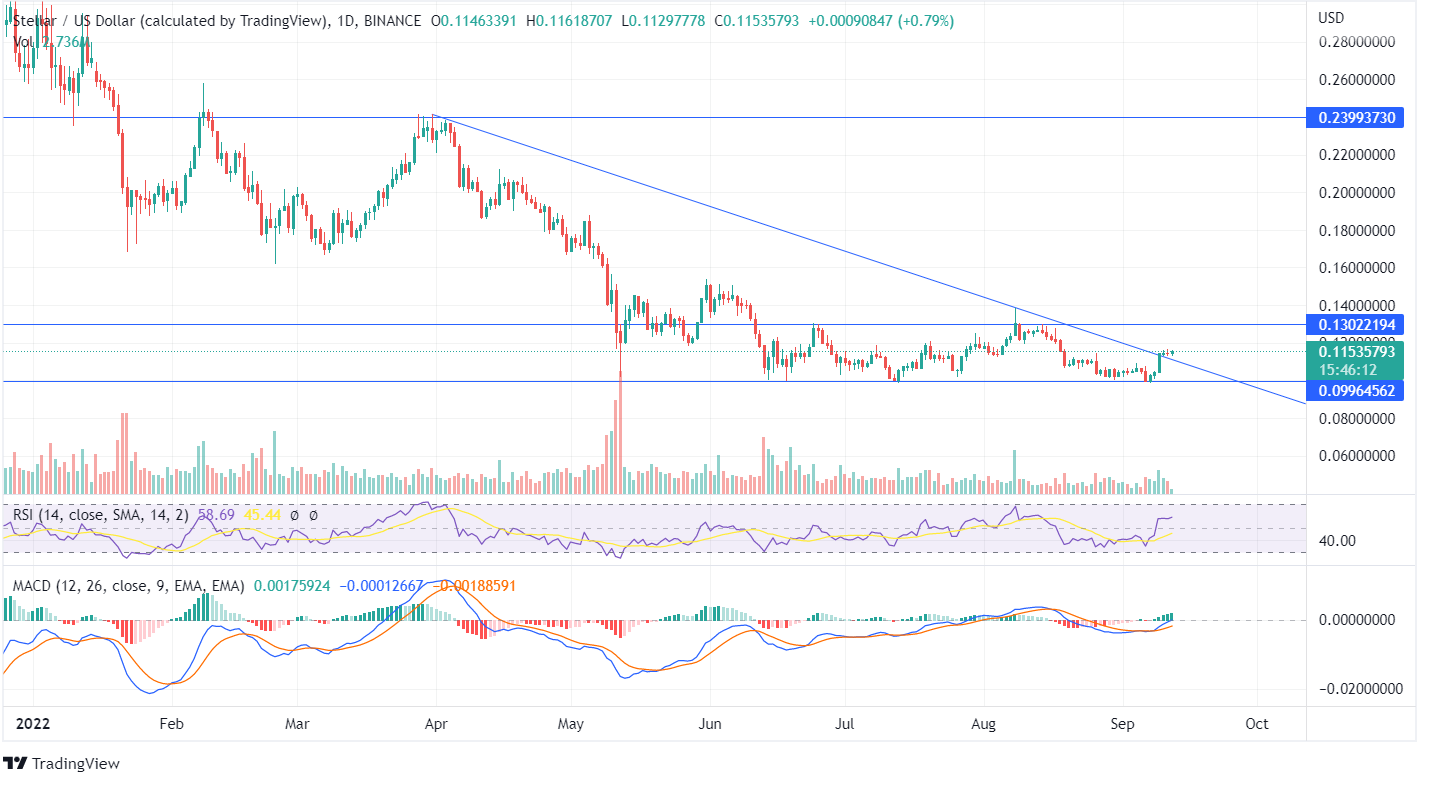
Stellar (XLM) shows a turnaround from its support line of $0.0996 as the bulls try to push the price upside. There has been the formation of a lower low in the last few days, and the value has been moving in a sideways channel with remote movement.
XLM, like other digital currencies, shows a downtrend pattern. However, once the price of XLM closes above the recent higher peaks, an up-trend pattern can be expected. The RSI indicator is 58 shows Stellar may trade towards the overbought zone.
The MACD line is ahead of the Signal Line, and the histogram showing green candles signals a bullish trend. The price had inclined decently since the MACD gave a bullish signal. The volume bars move below average, and once the bulls show positive sentiments with additional buyers, an up-trending market can be expected. For a detailed analysis, read our XLM prediction before investing!
The XLM price has recently suppressed the downtrend line and may ascend if the price closes above the top horizontal line of $0.130. On August 8, the price faced rejection for an ascending move as the bulls tried to close the price near to its highs but couldn’t close, and the price closed back to its resistance.
The previous week’s candle shows the bulls pushed the price significantly from its lows, and the forming bullish candle has recently suppressed the trend line. The price of XLM moving sidelong in the last few weeks shows neither the bulls nor the bears are able to take any major price action, and there has been indecision in the Stellar market.
Like other cryptocurrencies, Stellar being in a neutral zone indicates the investors should wait for the forming candles. Once the price breaks the support or the resistance point, strong price action can be expected in the long run. There is a requirement for active investors to show positive moves in any direction as the volume bar moves below average.


