
On February 14th, Friday, the Solana price projected a 3.73% jump to reach a trading value of $200. This uptick outperforms the leading cryptocurrency, Bitcoin, amid the broader market consolidation as whale accumulation intensifies. Moreover, the latest onchain report shows Solana outpacing the Ethereum blockchain in terms of the average transaction fee, signaling sustained network strength.
Key Highlights:
- The formation of a double bottom pattern sets Solana’s price breakdown below $177.5 support.
- The SOL price holding above the 200-day exponential moving average hints the broader market sentiment is bullish.
- Since January 9, 2025, Solana’s 7-day average transaction fees have surpassed those of Ethereum.
Solana Whales Accumulate as DeFi Adoption Grows
In the last three weeks, the Solana price recorded a notable correction from the $270 to $198 floor, accounting for 26%. This discounted value witnessed renewed whales’ interest, indicating that the investors continue to follow a buy-the-dip sentiment.
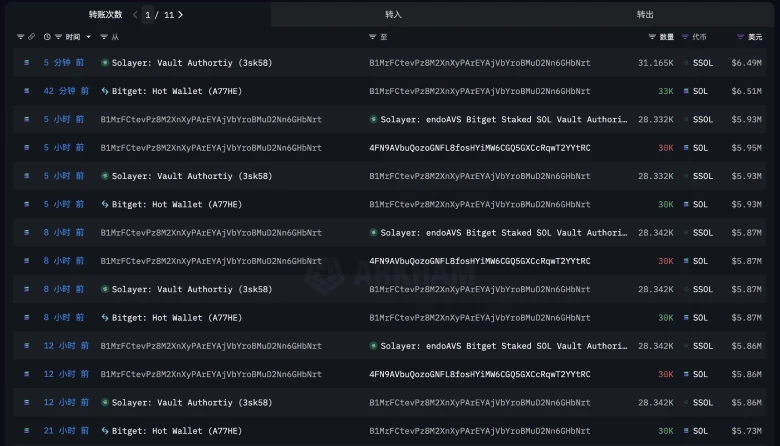
Onchain data shows a whale address has withdrawn 123,000 SOL (worth approximately $24.04 Million) from crypto exchange Bitget at an average price of $195. The asset was then deposited to restaking protocol Solayer and converted to SSOL.
This transaction signals increasing DeFi adoption in the Solana ecosystem.
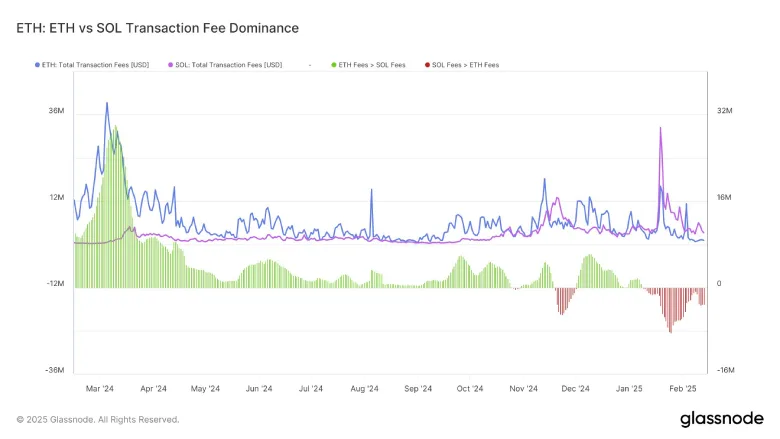
Another notable development is Solana’s 7-day average transaction fees surpassing Ethereum’s since January 9, 2025. Glassnode data confirms that while SSOL’s dominance weakened in February, the weekly fee difference still exceeds $3M, demonstrating sustained strength over ETH.
Increased fees suggest heightened network usage, reflecting growing demand for Solana-based applications.
If the trend continues, the Solana price could drive a sharp reversal trend and renew a sustained recovery momentum.
Double-Top Pattern Signals Solana Price Drop to $121
The daily chart analysis of Solana price shows a double-top reversal pattern, with neckline support at $177.5. The chart setup is characterized by two major reversals from an almost horizontal resistance, indicating intense overhead supply.
The correction under this pattern has bounced slightly from the 200-day EMA to reach the current trading price of $200. If the market selling persists, the SOL price could plunge 12% to challenge the neckline support and drive a major downfall to $121.
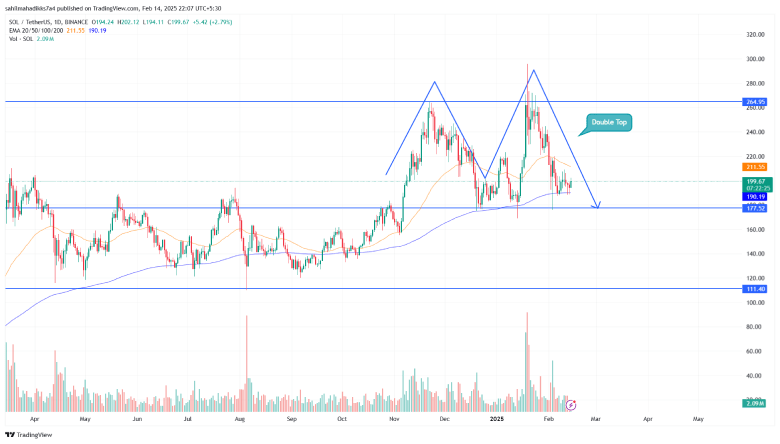
Conversely, if the whale accumulation and network growth continue to bolster the SOL market, the price could hold above $177.5 and shift the downward trend to sideways. The anticipated consolidation may extend for weeks but could recuperate the bullish momentum.
Also Read: Michigan Proposes Bitcoin Reserve Bill, Becoming 20th U.S. State to Pursue Crypto Legislation
