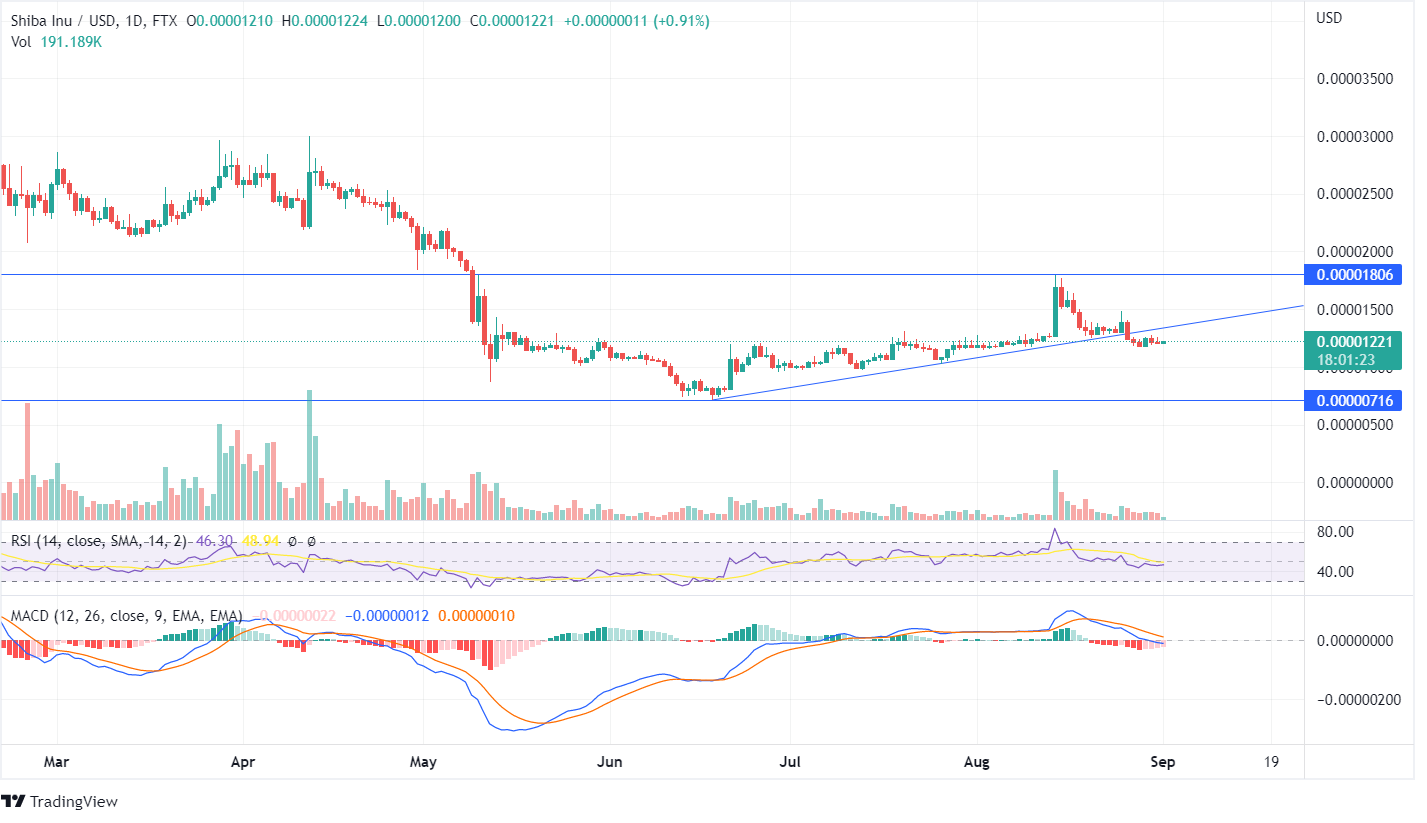
Shiba Inu started to rise from its lows, and after reaching the resistance point of $0.000018, the token turned around and descended towards its support line. The SHIB token was taking the support of the up-trend line and was moving upwards. However, the value couldn’t trade above the peak.
The bearish candlestick from August 26 shows the price suppresses the up-trend line and begins to fall with a marginal decline. Like other cryptos, this token also shows a turnaround from the resistance point as the price has been moving sideways between a price range. Check our Shiba Inu coin prediction to know if the consolidation will end or not!
The SHIB coin recently entered the overbought zone as the price was ascending, and the RSI is 46, currently showing neutral price action. The MACD line has been trading below the Signal line since mid-August. While the histogram also has red candlesticks denoting a bearish trade. However, the Shiba Inu token has already declined from when the MACD gave a bearish signal.
The previous week’s candle closing below the trendline showed a huge decline as the price hit the resistance, and the bears pushed the price downwards. The forming bullish candle shows that the bulls tried to push the price upside but couldn’t close above the trend line.
The technical parameters are currently neutral, and the investors must wait for future candlesticks for confirmation of the trend. The bullish investors should wait for the price to ascend along with the supportive volume, as the SHIB token shows a downside momentum in the upcoming days.
Once the price reaches its lows of $0.00000716, a turnaround can be anticipated. However, if the price of Shiba Inu closes below the lows of $0.00000716, a strong bearish trend may begin.


