On January 9th, Thursday, the frog-themed memecoin witnessed a 6% drop to reach the current trading value of $0.0000167. With the Bitcoin price correction accelerating selling in the altcoin market, the Pepe coin price teases a breakdown below the key bearish pattern. The onchain data registering notable whale selling further promotes the potential for prolonged downfall.
According to Coingecko, the PEPE’s market cap stands at $7.04 Billion, while the 24-hour trading volume stands at $1.47 billion
Key Highlights :
- The falling Pepe coin price could witness a crucial support retest at $0.0000166, followed by $0.000012.
- The formation of head and shoulder patterns bolster PEPE sellers for a major breakdown below $0.0000166.
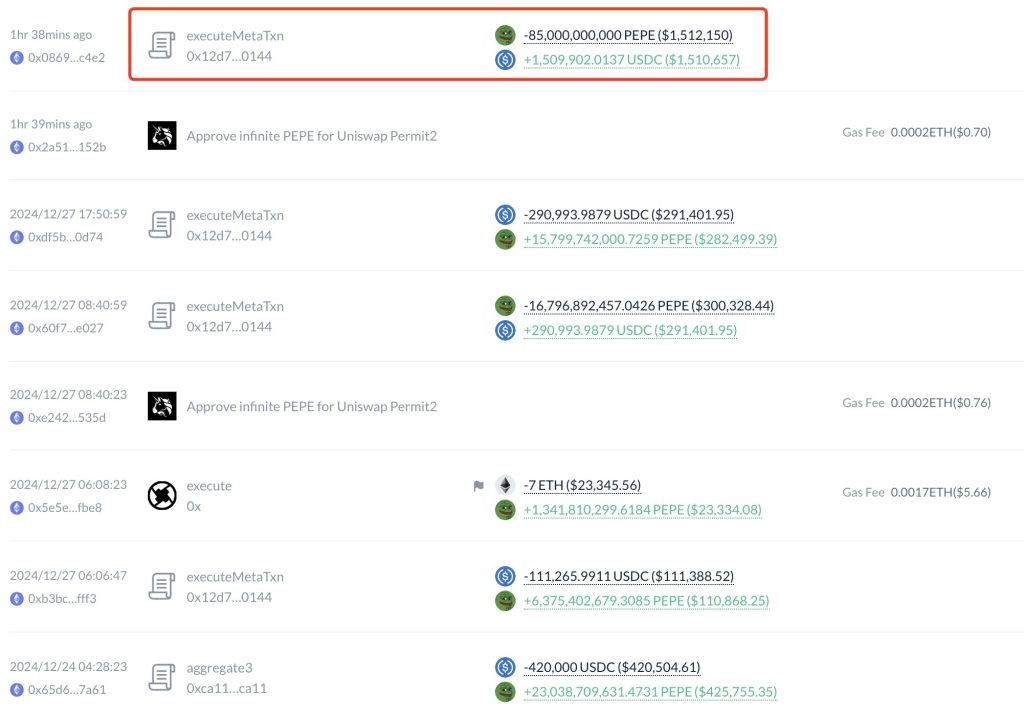
- A PEPE whale sold 85 billion tokens for 1.51 million USDC amid a market downturn.
Whale Reduces PEPE Exposure Amid Market Decline
As the cryptocurrency market faced a downturn, a significant whale holding PEPE tokens executed a major sell-off. According to data shared by Lookonchain, the whale sold 85 billion PEPE tokens for 1.51 million USDC in a transaction conducted just one hour prior to the report.
Despite the large sell-off, the whale still holds a substantial 180.8 billion PEPE tokens, valued at approximately $3.2 million. The partial selling suggests the large holders may want to reduce their exposure in PEPE coins amid a declining trend.

Pepe Coin Price Reversal Pattern Hints at Significant Bearish Downfall
Pepe, the Frog-themed memecoin, has faced a substantial downturn from $0.000021 to $0.0000169 in the current market correction. However, this 22% fall, when analyzed in a daily chart, shows the formation of a classic reversal pattern called head and shoulders. The chart setup consists of three peaks: a central, higher peak (the “head”) flanked by two lower peaks (the “shoulders”).
Currently trading at $0.000017, the Pepe coin price is less than 5% away from a bearish breakdown of the pattern’s neckline support. Theoretically, this breakdown drives a downfall of the same length as the distance between the head’s peak and neckline.

If true, the memecoin could plunge 28% to hit $0.000012 support, followed by an extended downfall to $0.0000048.
Also Read: Bitcoin Price Chart Shows Major ‘Buy’ Signal, $135K Target Soon?

