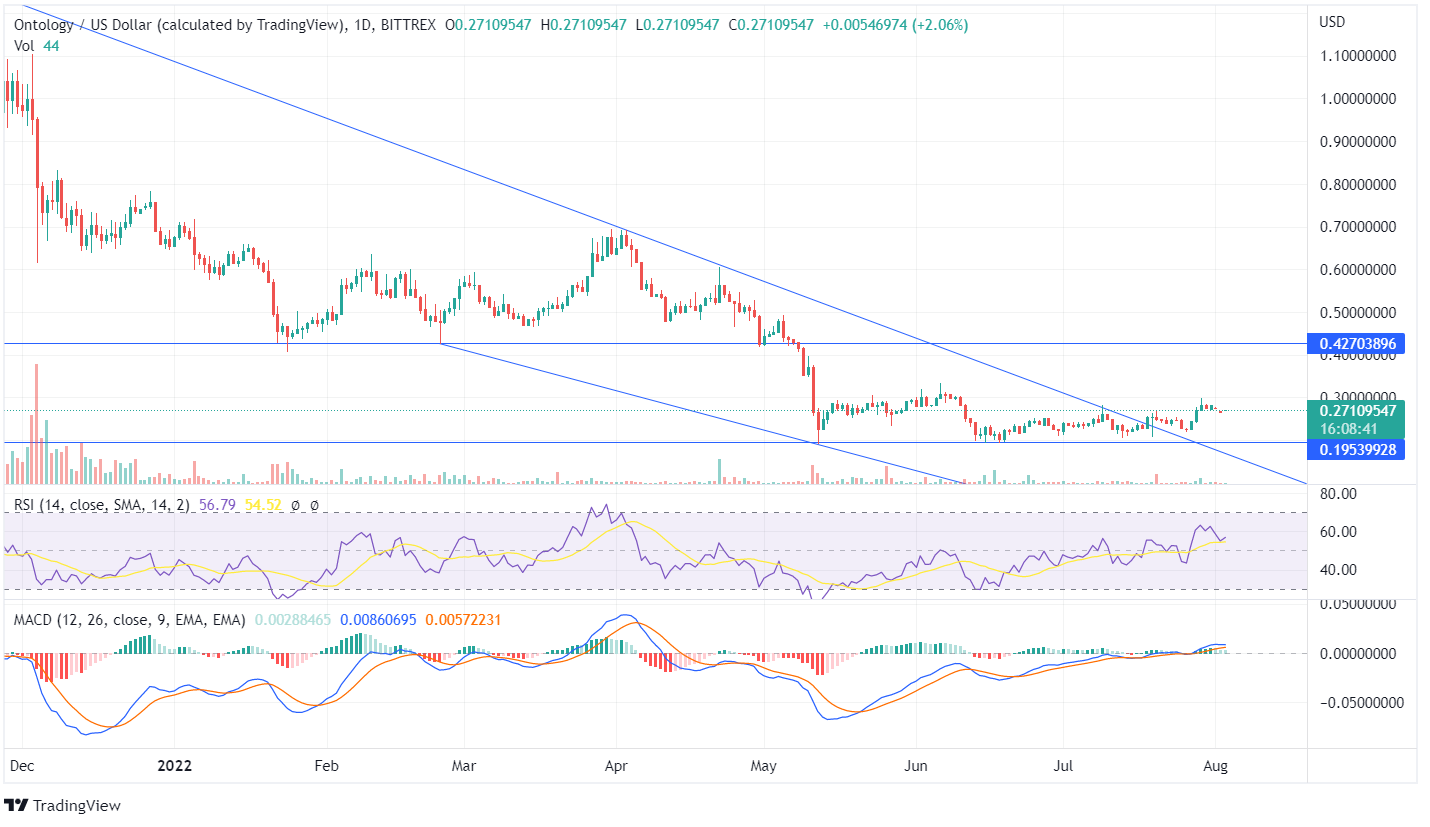
Ontology has been moving in down trending pattern as the token dropped from its peaks and has touched its lower lows of $0.27. The token shows remote price movement on the weekly chart trading between the sideways channel.
The previous week’s candle shows that the bull moved the price up but couldn’t close above the latest highs, and the forming bearish candle shows the further downfall of the token. The price suppressed the long stretching downtrend weekly line, but the ONT price didn’t show any strong price action. The indicators in the weekly chart are currently in the neutral zone as the price moves sideways, indicating indecision in the market.
The Ontology price got rejected twice on the daily chart for the further downfall, and the token took a U-turn from the support zone. However, there was no major price hike. The bulls should show positive interest with additional buyers for a surge in the price from its lows. Once the ONT price closes above the recent last highs of $0.33, it may reach its near resistance of $0.42.
The MACD line is ahead of the Signal Line, and the histogram chart shows green diminishing candles. Thus, we would suggest you wait for the forming candles. The RSI is 56 shows neutrality; however, the indicator line shows the price may move upside. The volume candles on the daily chart of Ontology show minimal movement as the volume bars are below average. The coin has been moving sideways between the price range of $0.33 and $0.19.


