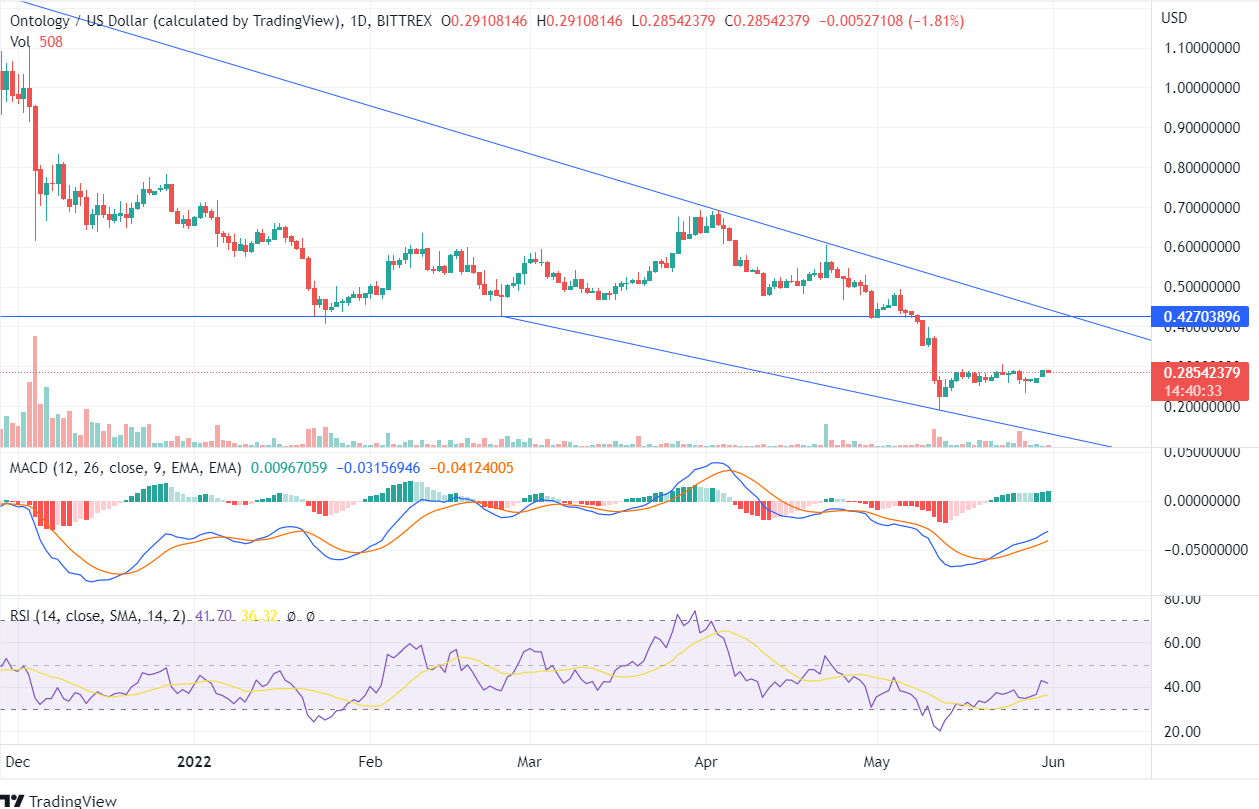
Ontology is in its lower low zone as the token forms lower low peaks with the current price of $0.285. ONT coin closed below the support Line of $0.427 and is currently moving sideways in consolidated momentum without any major price action.
The ONT price entered the oversold zone on May 11 as the bears continued to push the price down. There has been a constant downfall in price since then.
ONT took a turnaround from the oversold zone, and the RSI indicator, currently being 41, shows a neutral movement of the Ontology coin. The price has been moving below the downtrend line since November as in the bearish zone. The bulls need to give a hard upward push for an uptrend momentum.
The MACD line on the daily chart has begun to move above the signal line, and the histogram chart shows green candles indicating a bullish signal. However, for an uptrend confirmation, there should be the formation of higher highs and higher low peaks, and the price should also clove above the support line of $0.427. There was a favorable bearish volume on May 26, but the forming candles couldn’t close below that day’s low of $0.255, thus indicating a further rejection of the downtrend.
The weekly candle of the past two weeks shows inaccessible price movement towards any of the directions. The token reached its 52-week low of $0.190 on May 09, 2022. The technical parameters on the weekly chart are still in the bearish zone; however, once the price closes above the last peak of $0.693, a bullish trend can be expected in the long run.


