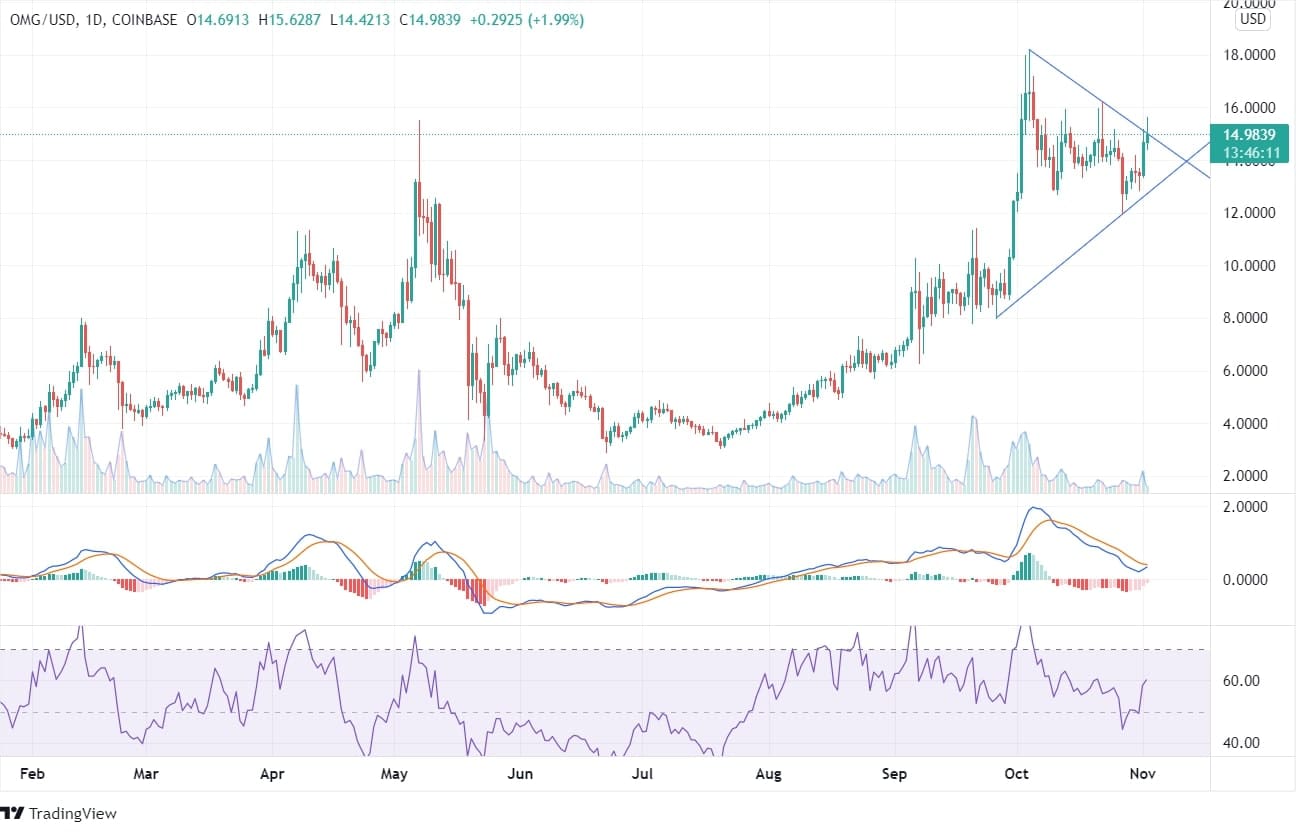
At the beginning of the year, the OMG Network began to grow from its lows of $2.40 and reached a high of $15.50 in May. After May, the coin price fell heavily and reached its support zone of $2.80. However, from July end, the bullish move has been a jackpot for the investors as the OMG token gave tremendous return within a short time span and majorly made higher highs and lower lows candles. It crossed its previous high of $15.5 and made new resistance with the high of $18.20.

In the daily chart, the MACD indicator shows that the MACD line is about to cross the signal line. The price trails in between the trend lines and have failed to cross the down trend line. This indicates the coin might continue to trade upwards. And, if the price crosses the downtrend line in the upcoming days, we can expect a bullish market. There is much bulls volume in the daily chart; a bullish move may happen.
The chart clearly shows that the OMG price is following the uptrend line and is moving upside. The minimum target price can be expected to be $23 if the price continues to uplift in the same motion. The MACD being the above signal line and the RSI at 67 heading towards the overbought zone can be a robust buy signal for bulls for the long term with a stop loss at $11.90 and take profit at $18.00. In the weekly chart, there is a formation of the bullish engulfing pattern. It is advisable to enter a long position when the price moves higher than the high of the second engulfing candle i.e. when the price crosses $15.62.

