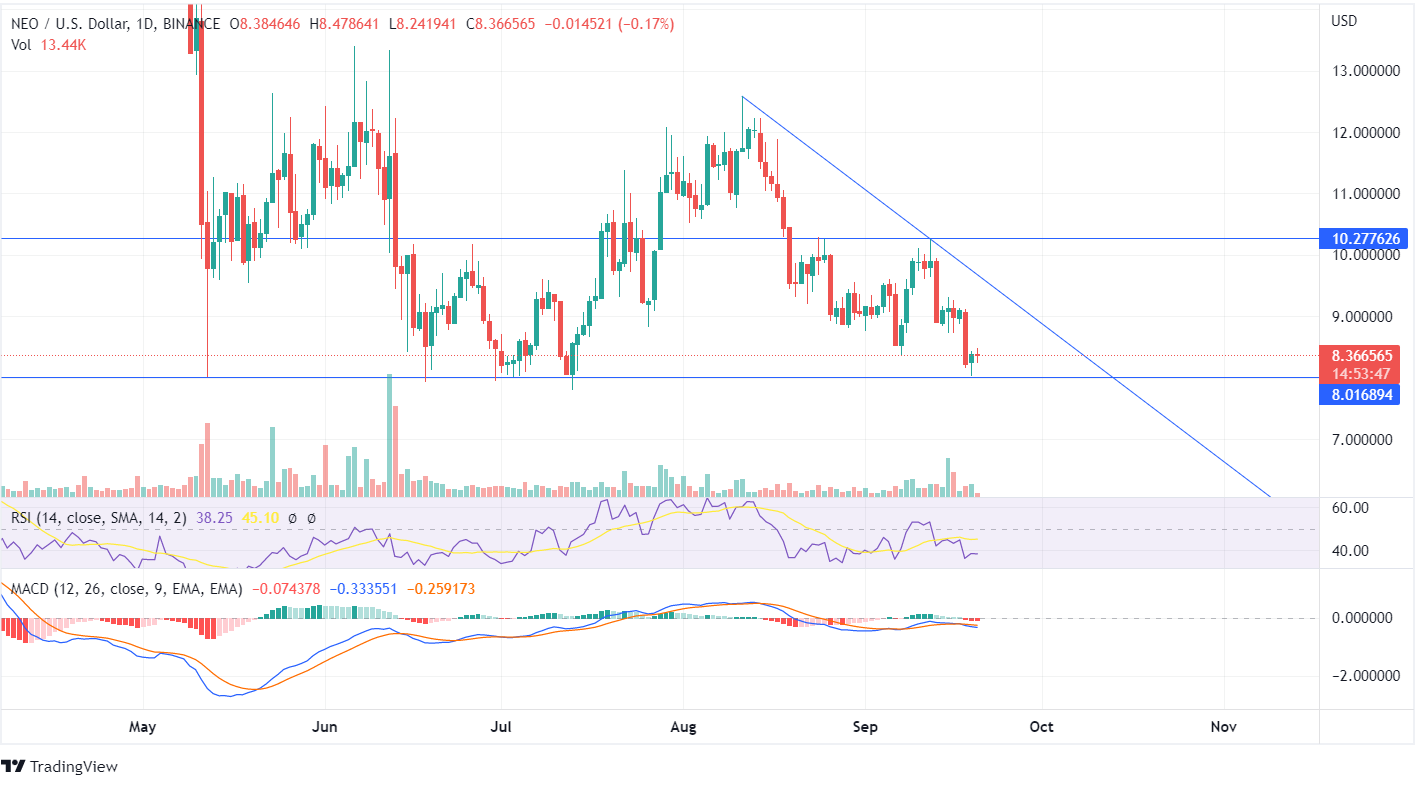
NEO falls from its higher highs like other cryptos and has reached its support zone with the value of $8.366. The token recently turned from the support line as the bulls tried to push the price upside, but the forming candle shows the price of Neo couldn’t close above the previous high, and the bearish candle is being formed.
The price of the Neo token has been moving in the sideways channel between $10.27 and $8.01. On September 18, there was a major decline in the price as the bears pushed the price downwards. MACD has been trading below the signal line, and the histogram shows red candles showing a bearish trend.
A strong downtrend pattern can be expected if the NEO value trades below the support line of $8.01, forming lower lows. The RSI indicator is currently 38, and the indicator line tilting downwards shows the price may head towards its lows. The volume bars are below average, showing indecision between the bulls and the bears. The volume bars being currently neutral requires additional traders for major price action.
In the weekly NEO chart, there was a major downfall in the price from its resistance point, as the price hit the downtrend line. The formation of a bearish engulfing pattern with robust decline indicates the bears are interested in pushing the price downwards in the long run.
Once the price of NEO closes below the low of $8.01, a gainful trade can be anticipated in the long run. The forming weekly candle shows the bulls are trying to make an up-trend move but are yet to close above the recent highs. If the price turns from its support zone, the NEO token may head towards the resistance point of $10.27, as the indicator in the weekly chart is still in the bullish zone.


