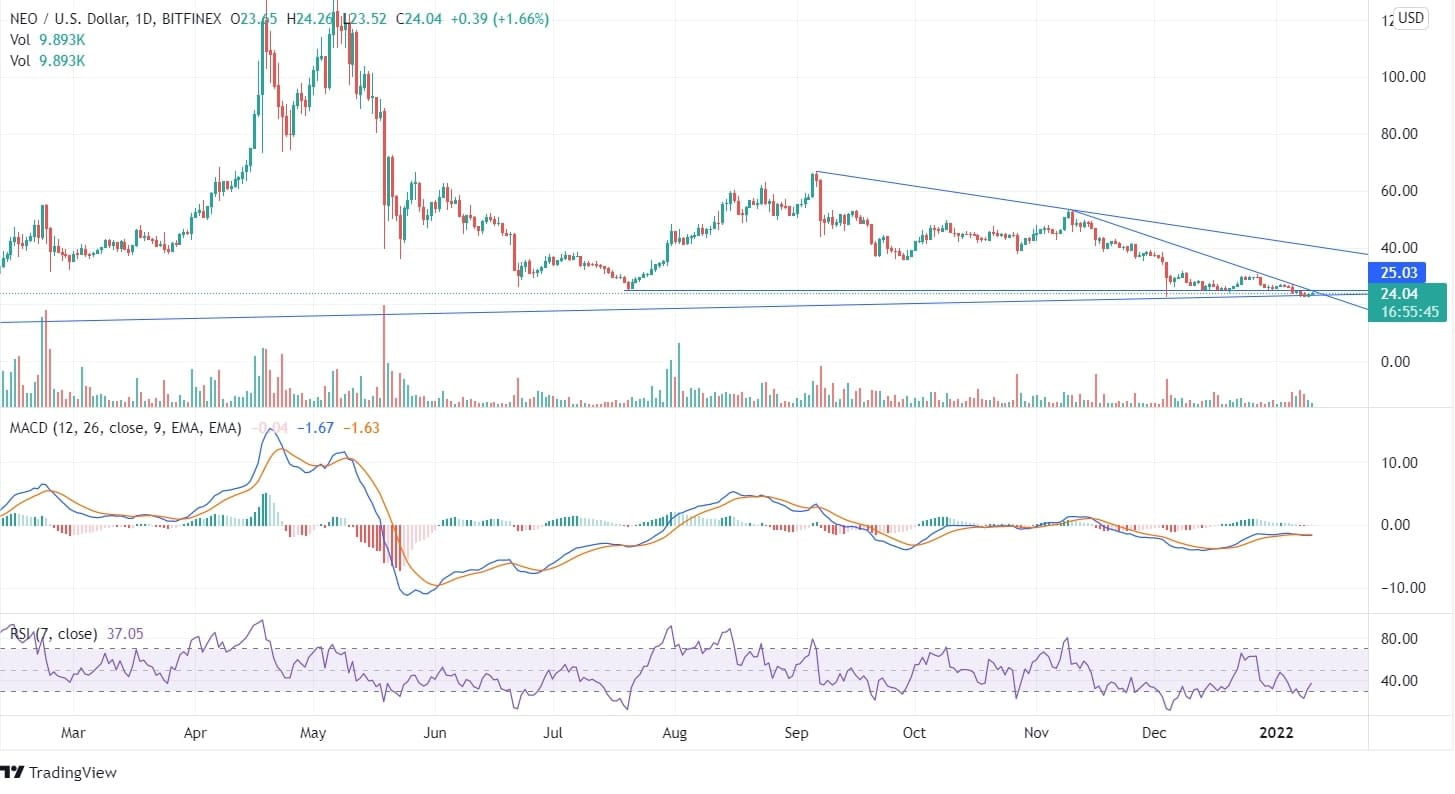
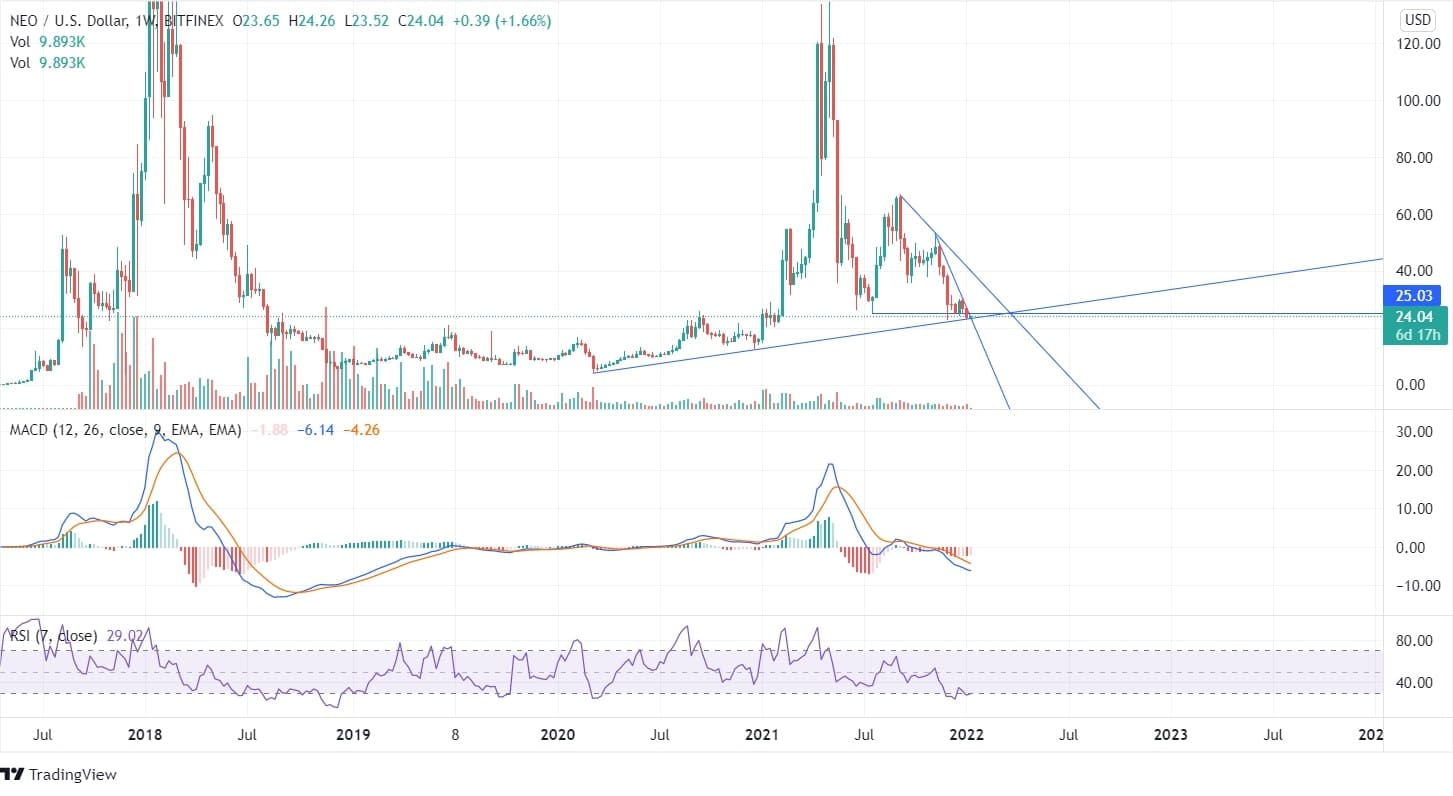
In the previous year, NEO has given a tremendous return to its bulls after which the coin price dragged down to its support zone and is trailing at the current price of $24.05. The coin is moving at its major support zone and is taking the support of the up-trend line stretching over from March,20 in the weekly chart. The coin is moving in the downtrend pattern for the past few weeks and is still in its bearish zone.

The RSI being at 38 has left the oversold zone and is heading towards the overbought zone. There is a formation of bullish divergence along with the price consolidation. However, the divergence can be confirmed once the price closes above the peak of $30.58. The volume bars have been in the favor of bears in the past few days and have still not shown much involvement of bulls.
On the weekly chart, on December 20, there was a formation of the bullish engulfing pattern, but the price failed to rise and returned to the upside trendline, which is also presenting a robust support line for the price action. On December 20, the price of NEO uplifted after touching the uptrend line and reached its peak. In the current scenario, the price is exactly at the edges of the trendline from where it may turn around, and a bullish momentum can be followed in the future, provided the candles don’t close below the trend line.


