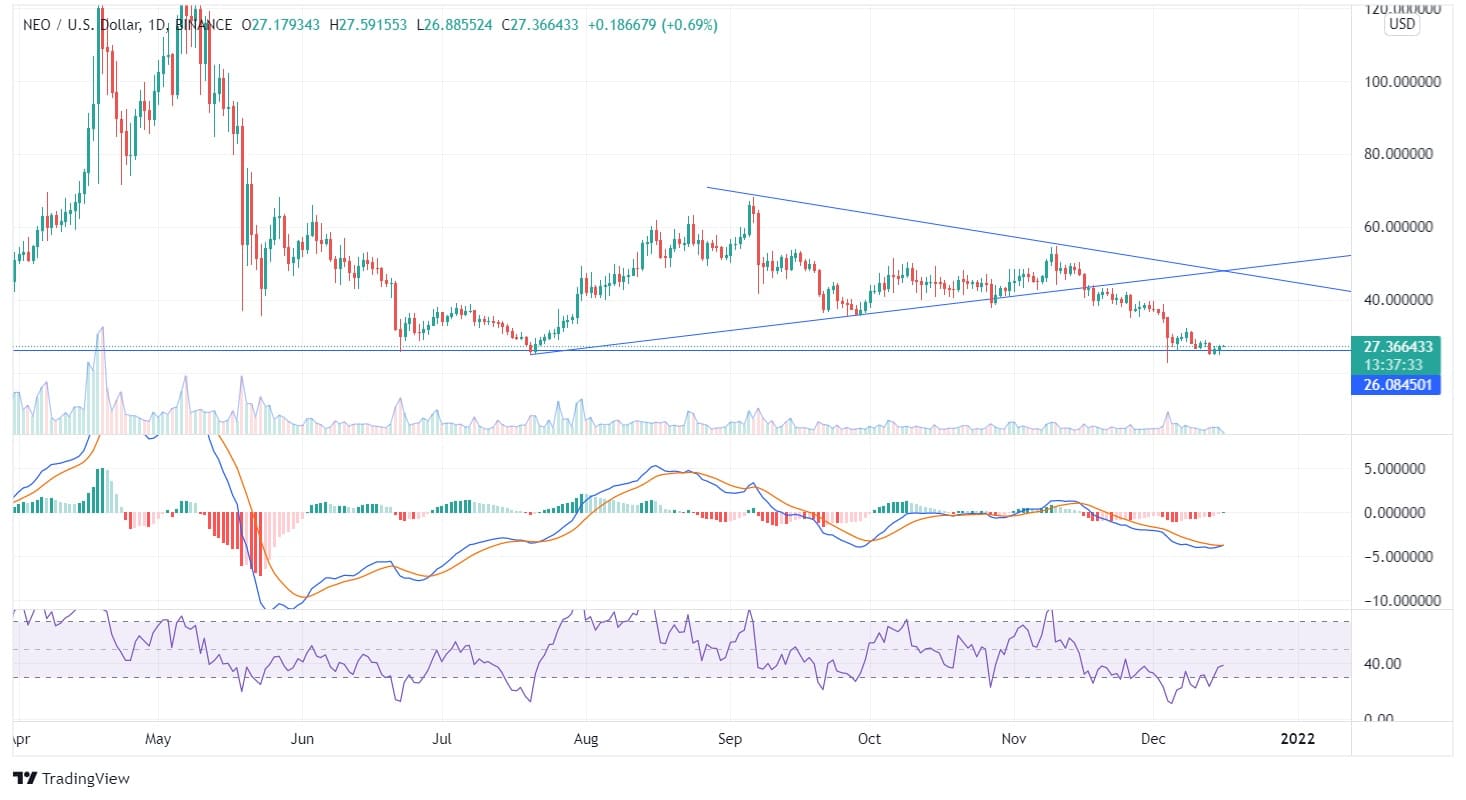
Neo coin is currently trailing at a similar spot from where it began to rise and reached its peak of $146.83 during mid-May 2021. The coin has been moving in a downtrend pattern for the past few months, and it has fallen significantly in the last 7 months. The coin is moving at consolidated momentum with slight price movement from the past week with an impartial signal of future price flow.
The MACD line and the signal line intersect with green histogram candles on the daily chart. The MACD can give a strict buy signal in a day or two if the MACD line crosses the signal line. The volume candles can show isolated movement in favor of bulls or bears. The RSI being at 40 is currently neutral but reverting from the oversold zone, it may head to the overbought zone.
The weekly chart shows that the price is tested at the support line, has failed to descend and break the support line from the past 3 weeks. This price movement is an opportunity for the bulls.
Bull investors are prepared to take high risk for high reward as there was a continuous formation of bearish candles, which took the price down tremendously in 4 to 5 weeks. Still, this couldn’t break and close below the support line.
If the price traverses the support line and closes below it, a downfall in the coin can be expected to a minimum level of $14.14. However, if the coin uplifts from the current point and ascends, it might reach the edges of the downtrend line ongoing from September.
Neo coin may reach its recent highs if it continues to uplift and closes above the downtrend line.


