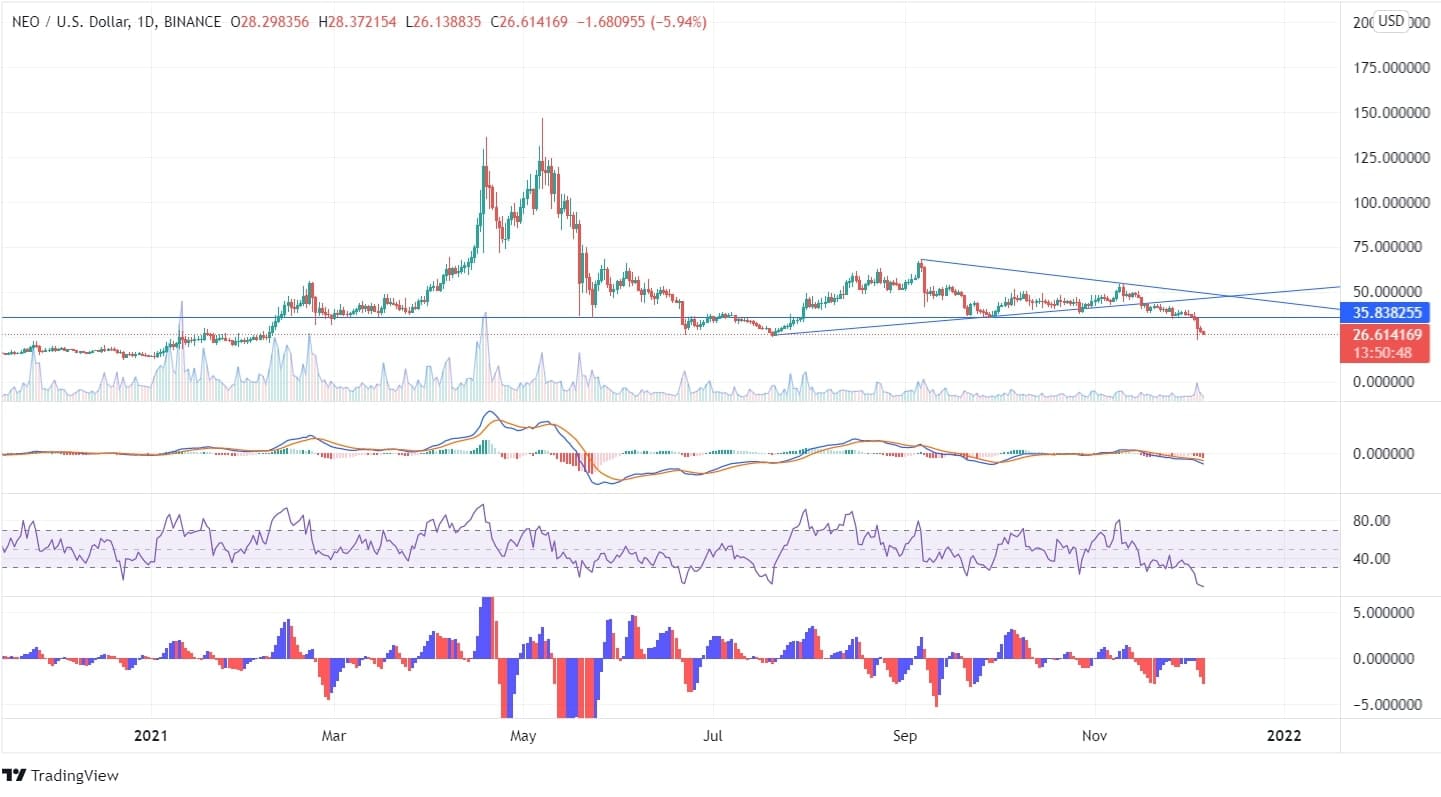
Along with most of the cryptocurrencies, NEO has also faced a tremendous downfall recently and has reverted to its support zone after reaching its high of $146.83. The coin has been moving in a downward trend since May, and though it uplifted to $68.06 at the beginning of September, it failed to ascend further.
The NEO coin has constantly been moving sideways in the past three months; however, it recently crossed the support line and descended further with the formation of bearish candles at a stretch. If the price continues to fall after breaking the recent low of $22.93, it may reach a minimum price level of $12.64.

In the weekly chart, the coin is moving in a downward pattern and is heading towards its deepest price level. The last three bearish candles being formed are in a downhill pattern with lower highs and lower lows. In the past four weeks, the price fell massively from its highs of $54 to its recent price of $26.

