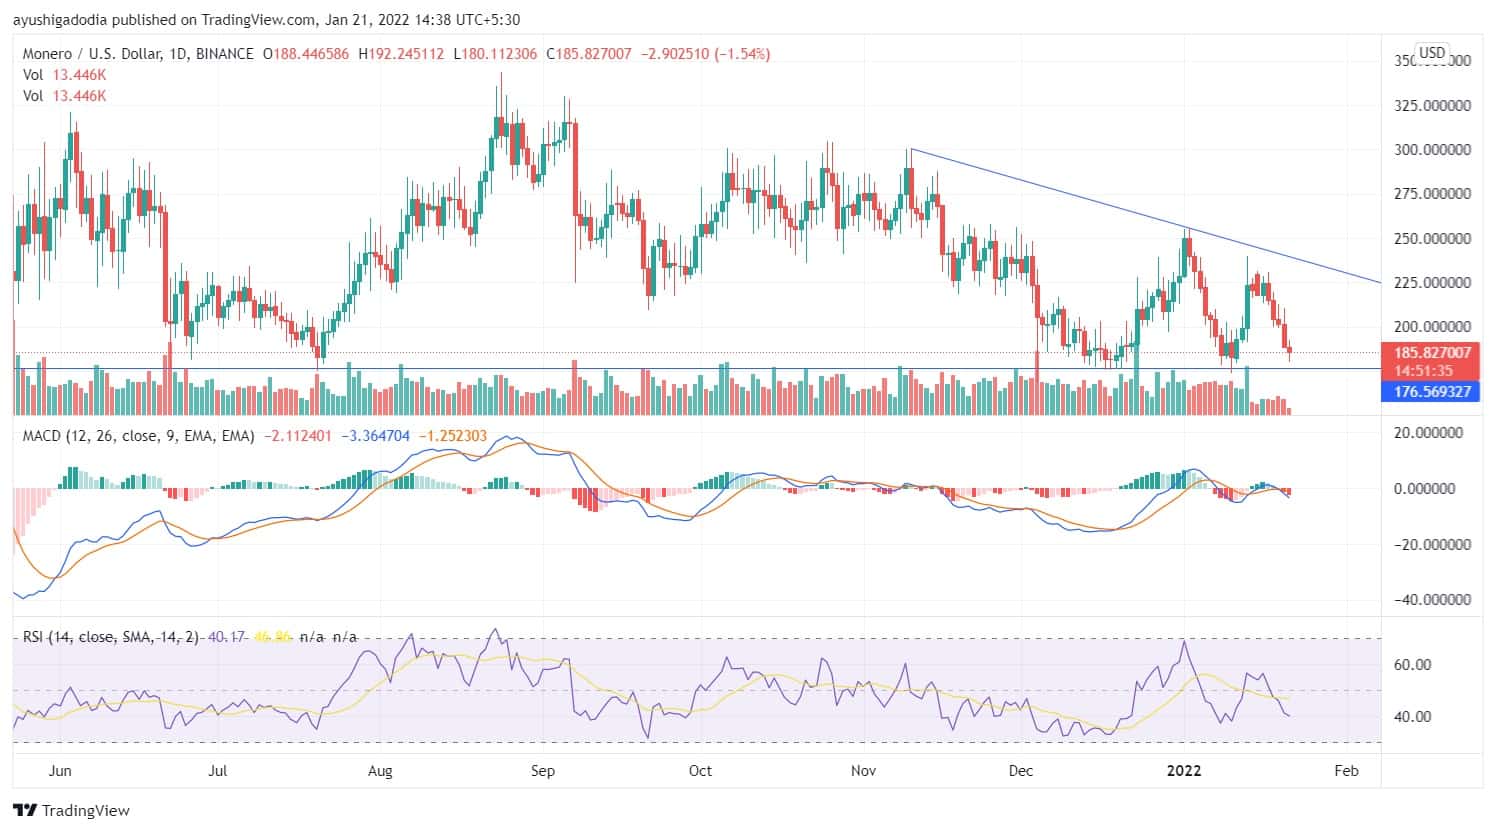
Monero price is constantly declining from its peak of $300 from last November onward and is about to reach its support line of $176. The XMR coin began to rise during December but formed a lower peak at $255 compared to the previous peak of $300. From the last December to January period, XMR gave a return of 45% to its investors, while from January 02 to the current date, it faced considerable correction.
If we look at the 4-hourly time-frame chart, the XMR coin has started to rise from its support zone, and upliftment in the price can be expected. The coin got tested at the support line, and a swing low was formed as the price failed to reduce further. If the price closes above the swing high of $192, a bullish momentum can be expected in the upcoming days.
In the above price chart, the MACD line being below the signal line indicates the coin might correct further. The RSI indicator being at 40, is currently trading towards the oversold zone. Monero is revolving at a crucial point from where it has ascended several times in the past, and it can be an opportunity for the bulls. However, if the XMR coin closes below the support line, a bearish momentum can be expected.
On the weekly chart, the price moves between the downtrend line and the support line. Once the coin suppresses the downtrend line and closes above it, a surge can be expected in the longer time frame, and a minimum target of $305 can be expected. During the previous week, there was an overall price movement of 37%, but the coin closes below the downtrend line.


