Founded in 2014, Monero has been following a revolutionary idea of hiding all virtual transaction details. With Monero developers receiving huge donations to the tune of half a million USD, investors are also getting attracted towards its cryptocurrency XMR.
Monero blockchain network obscures all the possible ways of finding the details of the sender, receiver, and amount through its network. The sender’s details are blurred using ring signatures, the amount sent is obscured using ring CT, and even the receiver address is hidden using stealth address loops. Monero blockchain network uses XMR as its currency, which is also referred by crypto investors as a cryptocurrency.
With a market capitalization of above USD 4 billion with almost 18 million coins in circulation. The current circulation is close to the ultimate circulation limit of 18.4 million coins. What potential does XMR have shortly can be deduced from the technical analysis of its price action using mathematical indicators, moving averages, and trend lines.
Monero (XMR): Technical Analysis
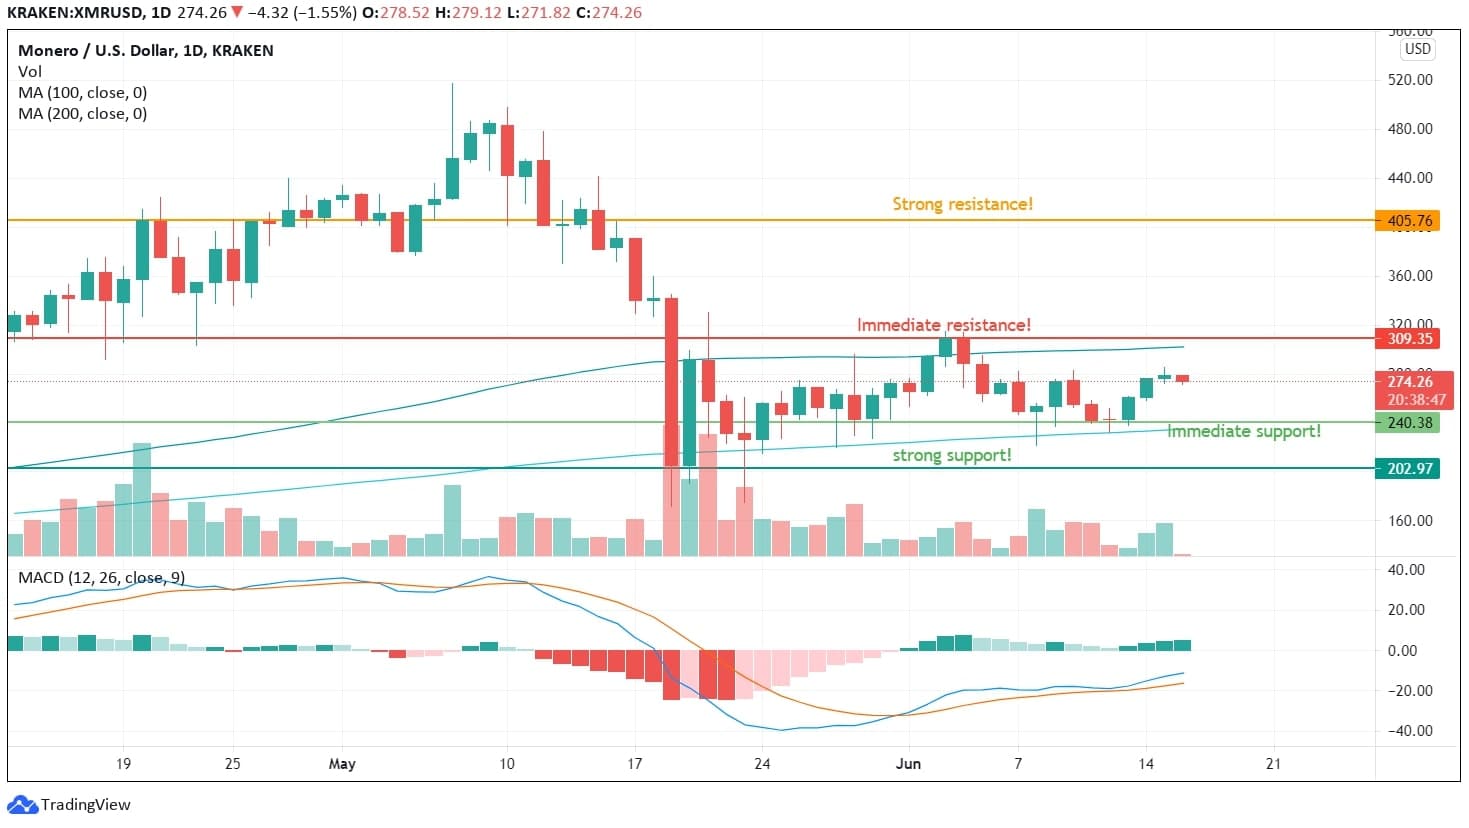
Strong Resistance: $405
Immediate Resistance: $300 to $310
Immediate Support: $240
Strong Support: $200 to $210
100 Day Moving Average: $301
200 Day Moving Average: $234
Monero price reached an all time high of $480 but after the fall in May, it is still trying to cross the immediate resistances. With the help of moving averages, trend lines, and other indicators we can see that XMR has been taking support from the 200 Day Moving Average at $233 and is facing resistance by the 100 Day Moving Average.
The current resistance is placed at $302 followed by the trend line resistance of $309. If Monero crosses these resistances on daily charts without sign of weakness there can be a huge rally as it will move in the next consolidation levels of $300 to $400. There is no resistance till the $400 level.
MACD is indicating a potential up move and has been increasing in divergence. If the volume of coins traded increases there can be a substantial up move to the tune of 50 to 100%. The only hurdle would be crossing the 100 Day Simple Moving Average without a red candle.
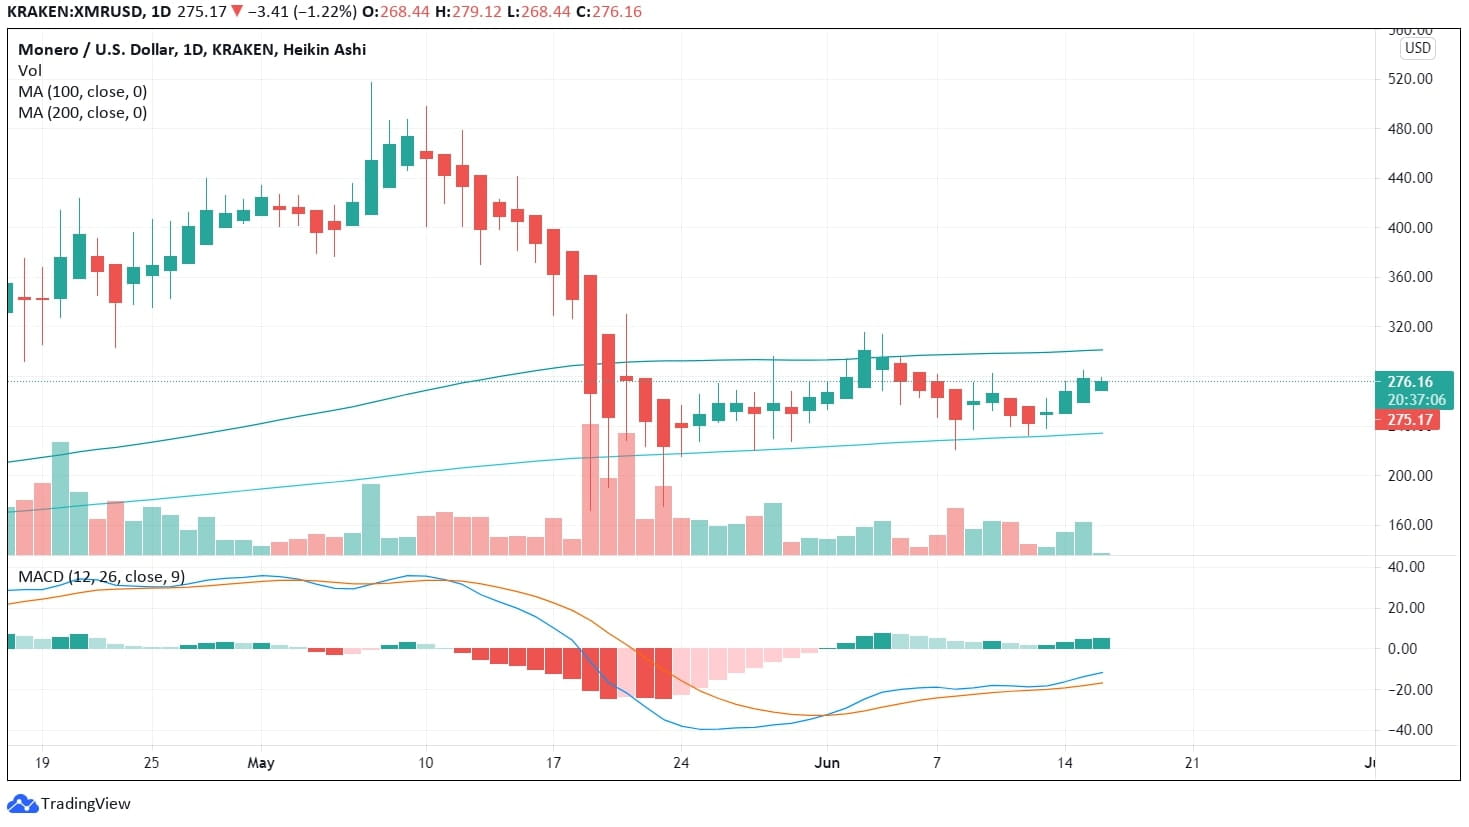
Heiken Ashi charts are showing a positive momentum followed by two back to back green candles with higher wicks. The upside momentum will be unlimited after crossing the resistance barrier placed around $300 to $310. There is a clear indication of positive sentiment over the last two or three days are the back to back red candles and uncertainty in the market. The formation of the third green candle adds to the buyer sentiment.
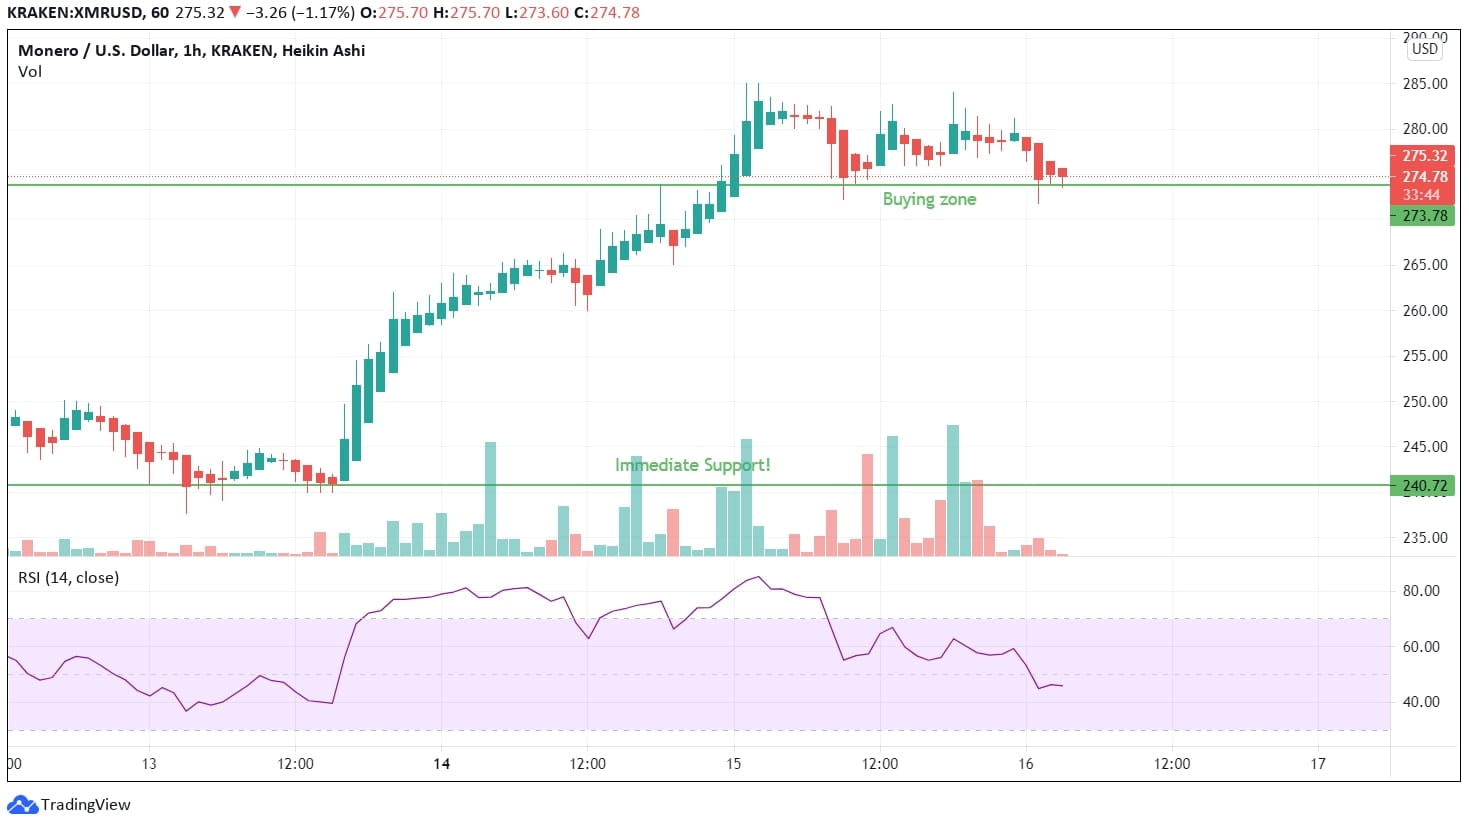
Hourly Heikin Ashi charts are showing buying zones from fresh highs of $275 indicating a shift in the support levels. If XMR respects these zones on daily charts, there can be a fresh round of buying. For that XMR must not trade lower than $270 on daily charts. Short term profit bookers will get a good selling opportunity near the $300 zones.
RSI histogram in overbought zones signifying strength since the 13th of June. With the current prices trading above the immediate support levels, we can estimate a growth and upside momentum to continue with slight green candles. Overall the histogram in overbought zones is again moved towards the positive zones.
The prices would face no resistance till $300. We recommend making an entry in Monero’s XMR coin only after it crosses the $300 levels on daily charts for better gains.


