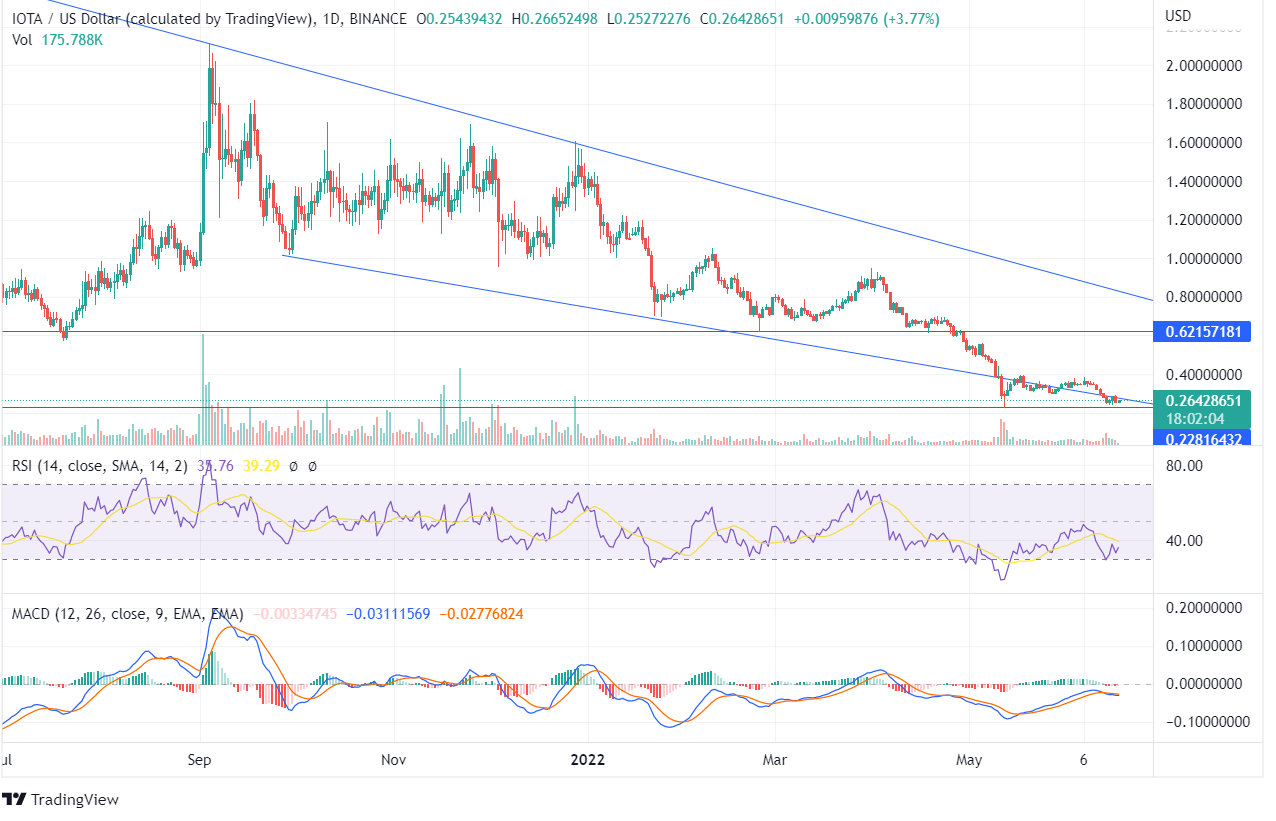
IOTA has been moving at the edges of the downtrend line on the weekly chart as the value continues to fall from its highs and is currently moving at the price of $0.264. The MIOTA token has been bearish in the past few weeks and has reached its lows. IOTA is trailing around the support zone from where it mounted towards its high price level in the past.
However, the constant formation of bearish candles may not allow the bulls to increase the price. The previous week’s candle shows a significant reduction as the price closes below the 3 weeks candle. There has been a formation of a bearish engulfing pattern in the previous weekly candle, which can further take the price towards its lower lows.
The MIOTA coin entered the oversold zone on the daily chart, and the price rose. However, the price couldn’t close above the high of $0.394 and showed remote price action. The RSI indicator is at 35, currently is neutral, and the IOTA price may move in any direction. The token is forming lower lows; on June 16, there was a huge downfall.
The MACD indicator line is trading below the Signal Line, giving a sell signal. The histogram chart shows red candles showing negative momentum. The volume bar was favorable towards the bears on June 13, but the forming candles couldn’t close below the low of $0.242. Once the MIOTA price closes below the Support Line of $0.228, a strong downside momentum can be forecasted in the future.


