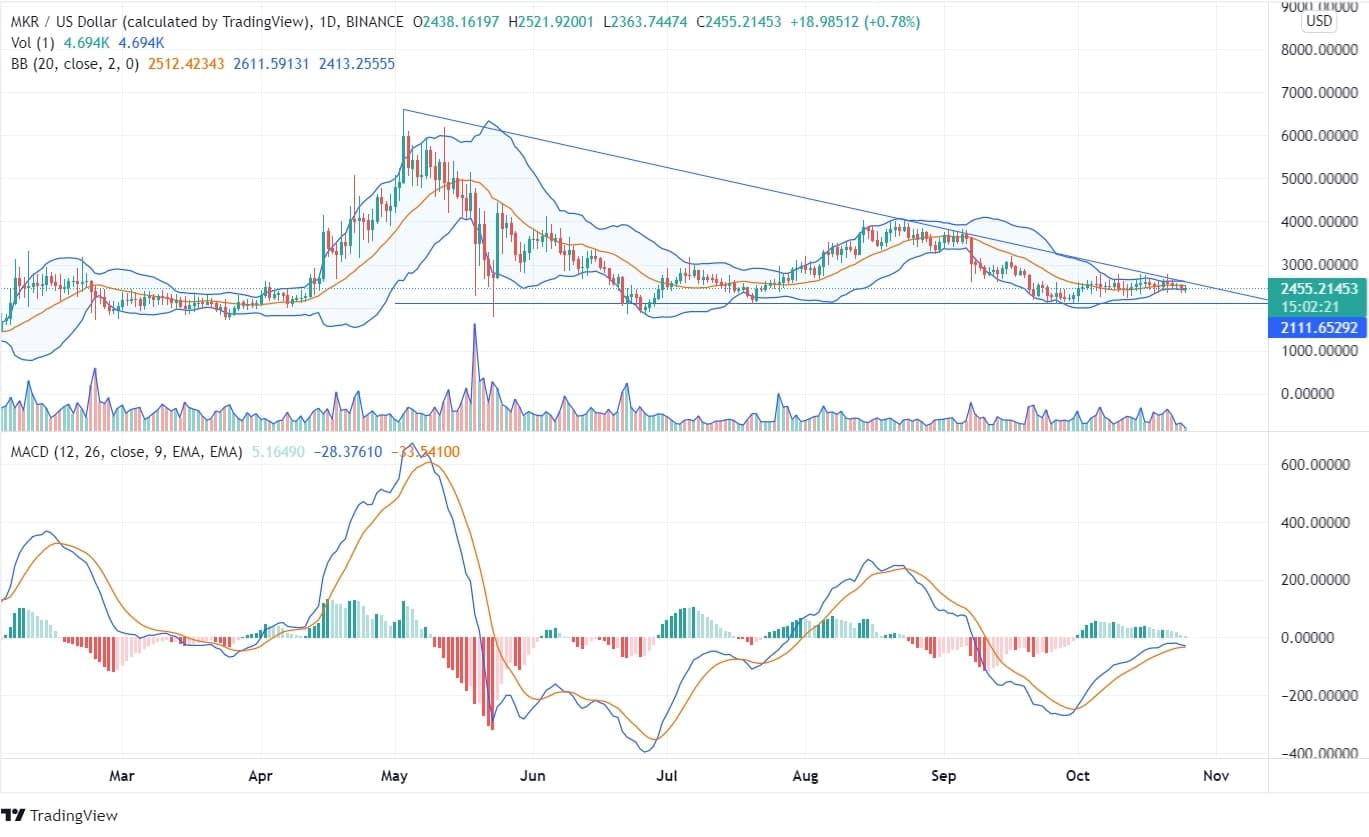
Maker (MKR) has been following the trend like other cryptos and began to rise from its support zone at the beginning of the year after breaking a long-term consolidated movement. In May, MKR was at its highs of $6339, after which the coin endlessly fell with lower lows.
In the current scenario daily, the technical chart shows a downtrend pattern and the price is moving in its support zone. The price is currently rambling in between the downtrend line and the support line. The price got tested at the downtrend line but couldn’t break and move higher.

The RSI being at 45 has started to move from its oversold zone to its overbought zone, giving the bulls a long-term hope. However, the script can take an upliftment if the price supresses the downtrend line coming over from the highs of May and crosses the recent high of $3192. If the price breaks the support line with technical parameters in favour, then we can expect a bearish momentum.
In the weekly, there is a formation of descending triangle pattern, which directs bearish formation and downside breakout. The MACD in the weekly chart is below the signal line indicating downward movement of price.
If the price moves upward, the minimum target can be expected to be $3829 with a stop loss of $2164, and if the price breaks the support line and moves downwards, the minimum target can be $1737.
Looking at the current situation, the investors should be cautious regarding their investment in the script as the weekly chart indicators give sell signals. Still, the daily chart shows bullish divergence.

