Litecoin reaches the 13th spot in terms of market capitalization, emerging as a knight in shining armor against the majority of the downtrend movement of tokens. LTC’s jump to success spikes its market cap to $5.64 billion, adding a billion in the last 24 hours. The outlook and possibilities offered by Litecoin in current crypto dynamics are unchallenged. Being a decentralized blockchain, the mining rewards for LTC are enormous.
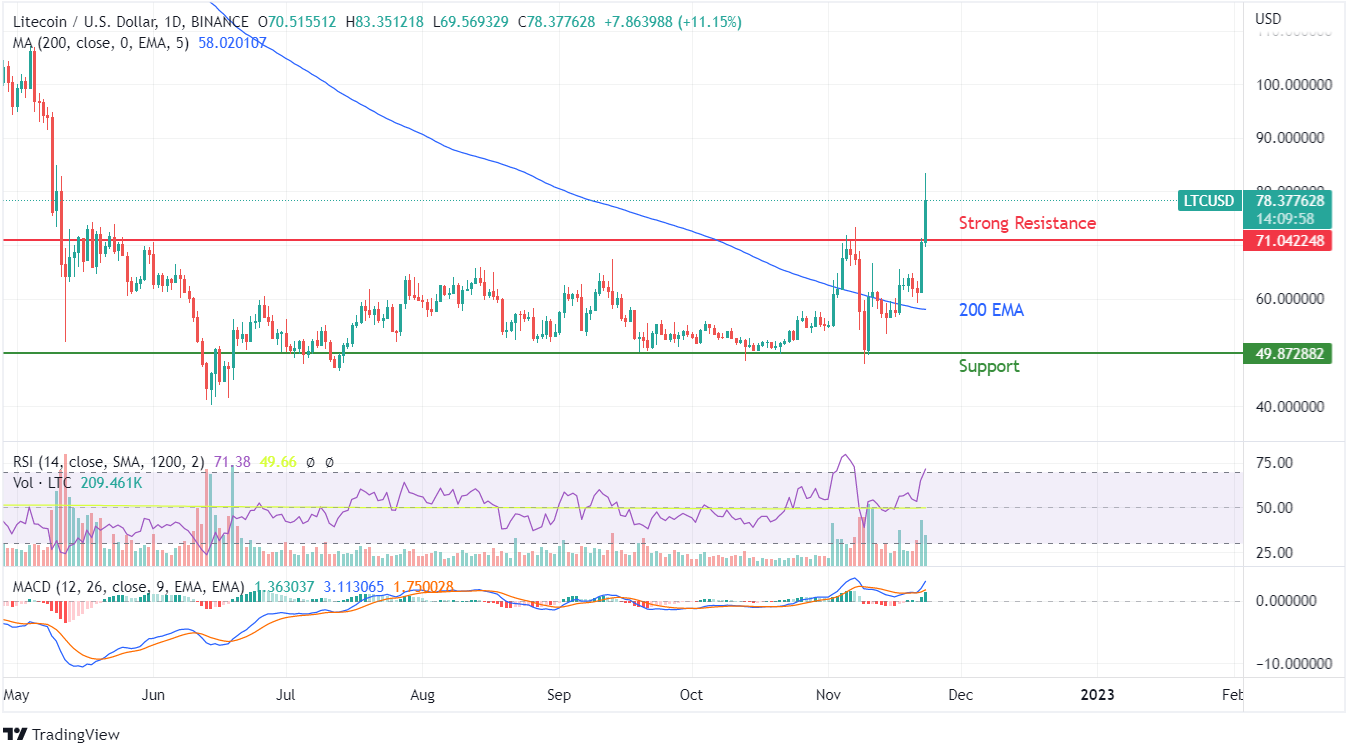
LTC’s price action has broken previous expectations of a downside movement. After support from 200 EMA, the breakout has spiked buying sentiment matching the previous bull run witnessed during the first few days of November 2022. The outlook for Litecoin has suddenly changed, but buyers should show caution before making an entry, as the token has already moved up by 60% in the last few weeks.
The uptrend confirmed by massive buying in the last three days confirms a positive sentiment regarding this cryptocurrency where the top leaders are failing to perform. With the strong performance, LTC has managed to surpass both Solana and Shiba Inu in terms of market capitalization, offering a better alternative for crypto investors.
While the cryptocurrency is down by 48% on a year-to-year basis, the prices have taken a huge jump in this month alone. Since LTC made a recent low of $49.8 on November 10, the peak value of $81.52 attained today created a tremendous gain.
On indicative analysis, RSI has jumped from the neutral level of 50 to a peak of 71. This price momentum has been made possible only because of the positive reaction of the buyers from the 200 EMA curve, who took it as a strong technical point of entry.
The MACD indicator has made a wide open gap with rising momentum that shows no sign of slowing down any time soon. The previous resistance of $71 was easily breached, which troubled the uptrend for a good six months. With this strong reaction, the possibility of Litecoin reaching $100 and $200 carries a higher probability. Read our Litecoin price prediction to know when it will cross the $100 mark!
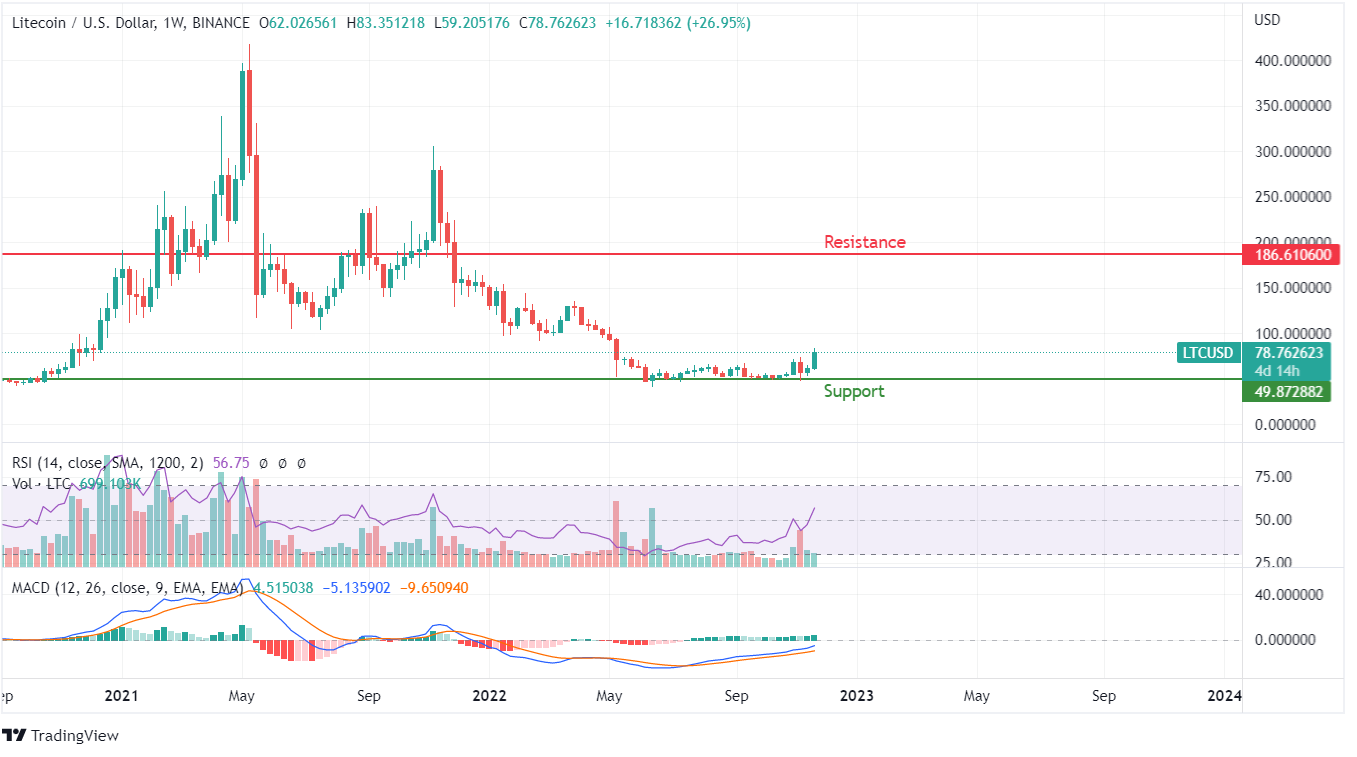
On weekly charts, LTC is displaying the initial signs of recovery as RSI is steadily moving towards overbought zones for the first time since December 2021. On the contrary, even the MACD indicator is attempting to enter into the positive axis.
The resistance from the current breakout showcases a bigger target of $180 above, which is a 100% movement from the last traded value of Litecoin. If the weekly candle continues to move ahead and make a positive trajectory by the last day, the possibility of the price moving ahead will increase by multiple folds.


