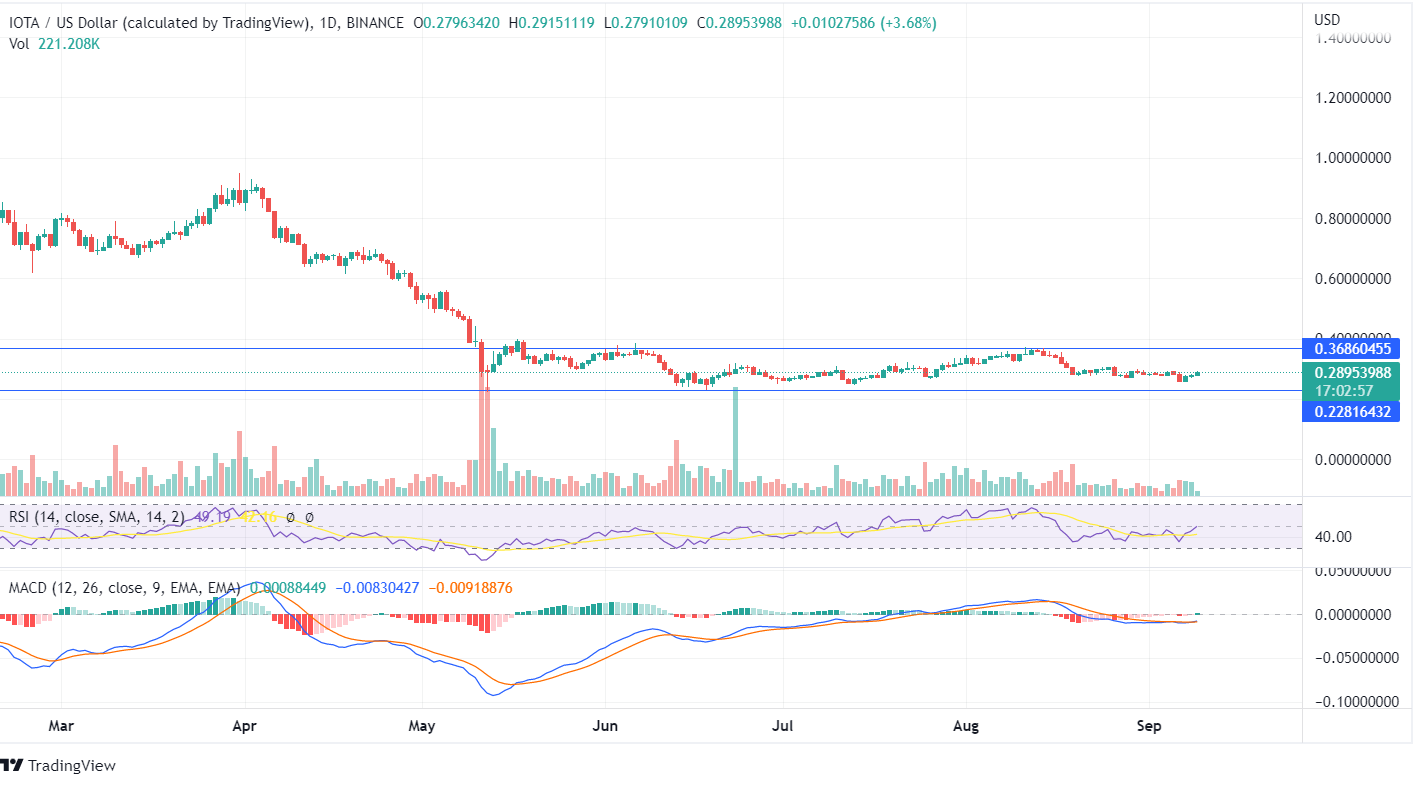
IOTA forms lower lows as the price declines from its peak over the past few months and is currently moving at the price of $0.289. The MIOTA token has been moving sideways like other cryptos and is showing remote price movement. The price is caged between the range of $0.368 and $0.228, and neither the bulls nor the bears can break the channel and show any major price action for MIOTA.
In the last 2 days, the bulls showed a positive move, trying to push the IOTA price upside with a decent move. In the last 4 months, the price moving between the channel indicates neither the bulls nor the bears are actively interested in robust price action, and the MIOTA token showing remote price movement forms indecision in the market.
The MACD Line has just begun to move ahead of the Signal Line, and the histogram has started to show green candles denoting a bullish signal. The volume bars require additional support from bulls or bears for a strong price move as the volume is below average currently. The RSI indicator is 49 currently, but the indicator line heading upwards denotes an upcoming bullish trade, and if the bulls push the price up, an up-trend pattern can be expected.
The forming weekly candle shows the bear tried hard to pull the IOTA price down but failed, and the price is revolving towards its highs. The previous week’s bullish candle showed a decent move in favor of bulls; however, the price of MIOTA couldn’t close above the previous high of $0.308.
The MACD indicator in the weekly chart has been bullish for the past few weeks. However, the MIOTA price reached its resistance after that and moved down. Investors should wait for the forming candles for a long run, and as the price breaks the support or the resistance point, a strong trend can be expected in the same direction.


