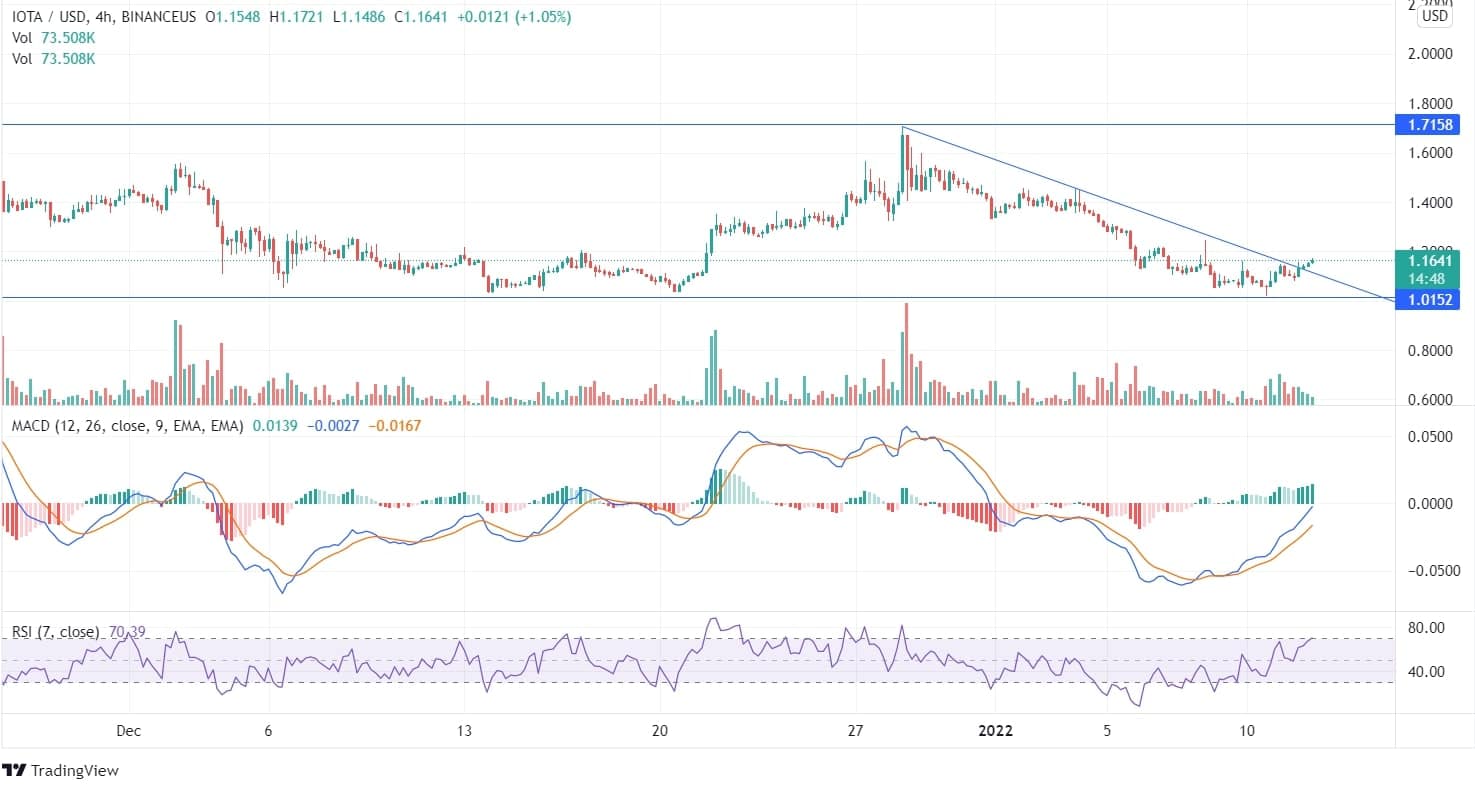
IOTA has been trending in a sideways pattern from the past few days with the peak at $1.71 and trough at $1.01. The price is trailing between the top and bottom horizontal lines. From December 28 onwards, the price is moving in a downward pattern with a massive decline, however, the coin recently began to rise after breaching the downtrend line extending over from December end. In the past three months, the coin faced significant price change.

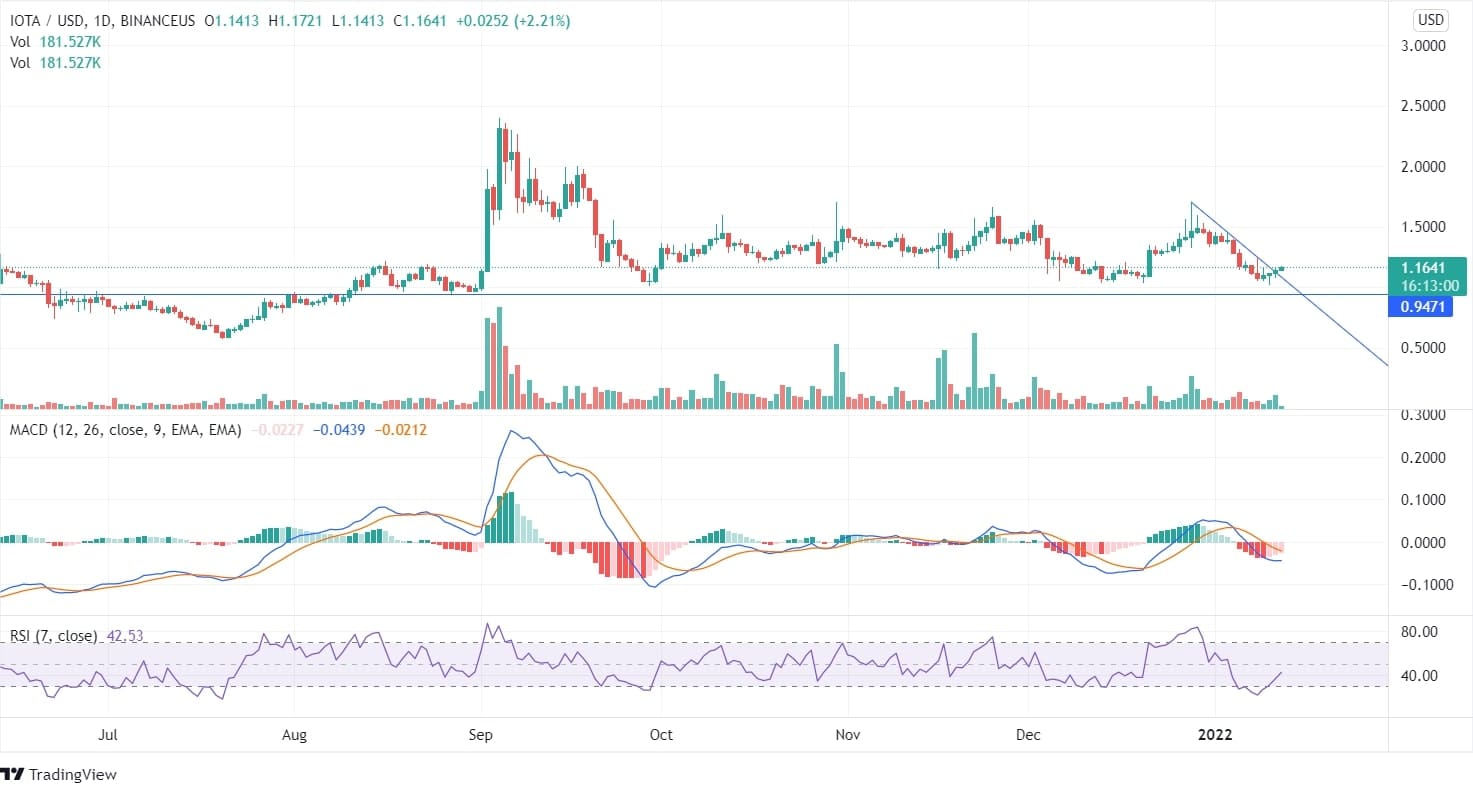
On the daily chart, we can see the breach of price from the downtrend line. The price has turned around from the support line and the bullish candles are being formed with higher highs. Though the MACD line is still beneath the signal line, it may soon turn around as the red candles are getting diminished and the indicator may shortly give a buy signal. If the price continues to rise, it may reach a minimum of $1.7. However, if the price falls down IOTA price may reach $0.5. On the long-time frame charts like weekly, the price got tested at the support line several times in the past but failed to break the line and descend. The price is recently evolving at the same point and upliftment can be expected in the upcoming days.


