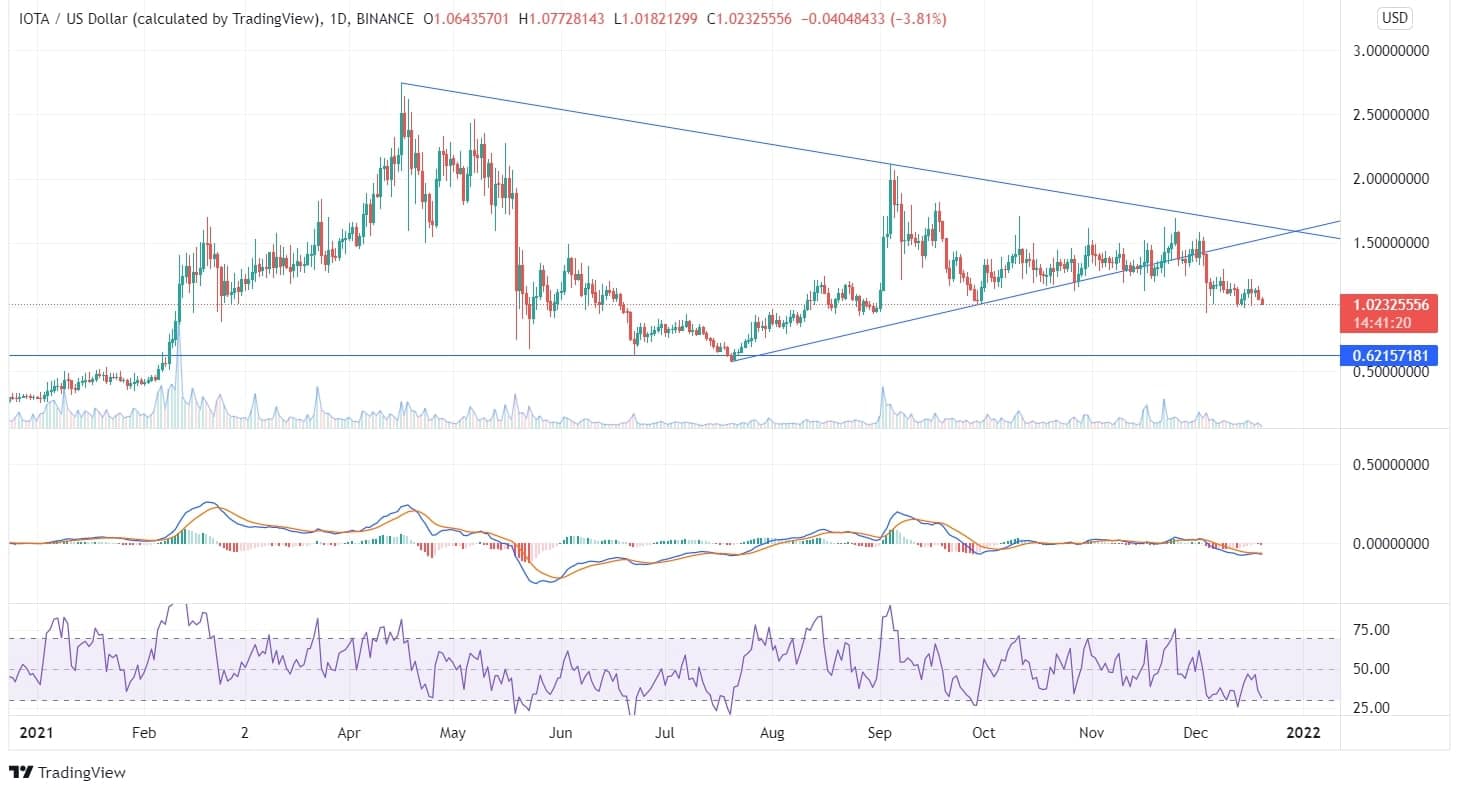
IOTA has been moving in a downtrend pattern and has fallen significantly this month. The coin has traversed the up-trend line extending from July 21, 2021, and is moving sideways with isolated price movement.
The coin has been at its high of $2.74 during the mid-April period, after which it formed lower lows. IOTA has been following the downtrend line continuously since mid-April, and the price has been touching the edges of the trend line and descending.
There is an existence of bullish divergence between the price and the RSI indicator, which may uplift the price, and the bulls may grab a profitable opportunity. If the price continues to decline, it may reach its low of $0.62.
However, if the bulls push the price upside and suppress the up-trend line, it may reach its previous peak of $2.11. The formation of bullish divergence can be a turnaround strategy for the bulls in the long run.
On the daily chart, the MACD line and the signal line are overlapping each other, which gives a neutral sign regarding the future IOTA price prediction. There are red candles in the histogram chart, but the coin has already descended tremendously from where the MACD indicator gave a sell signal.
The RSI being at 30 is in its oversold zone, and the price may fall to its recent swing low of $0.95. The volume candles do not indicate much involvement of bulls or bears. Thus, the price moves in the consolidated momentum.
On the weekly chart, there is a formation of bearish candles; however, the candles have not broken the swing low of $0.95. If the price breaks the swing low, it may reach its low of $0.62. The technical indicators of the weekly chart are already in the bearish trade.
Investors should study the fundamentals or wait for technical indicators to give a trading signal. Currently, the price moving sideways after a fall can be a high-risk investment. From the current point, the coin can further descend to its support line or may even recover as there is a bullish divergence in the daily chart.


