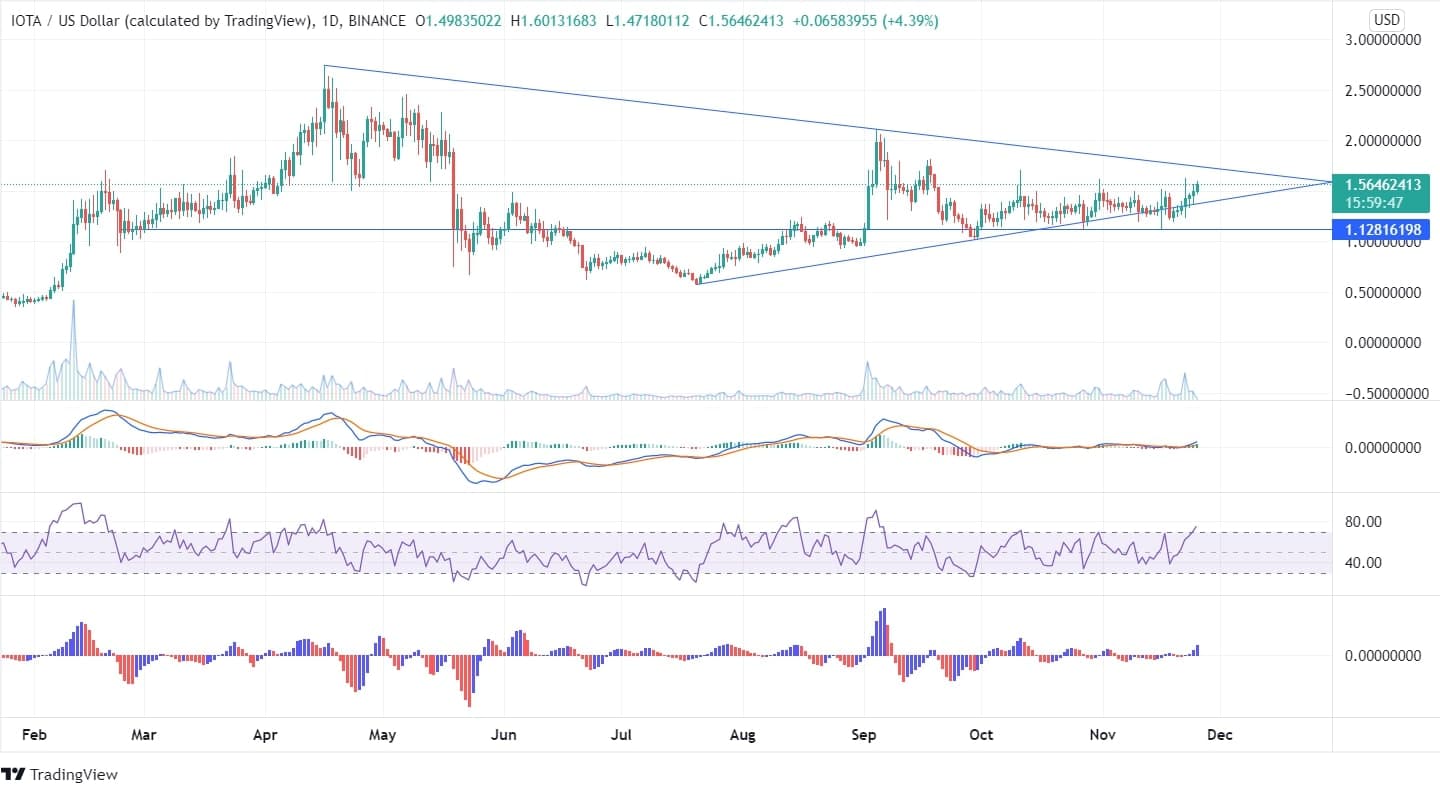
IOTA, like other cryptos, fell immensely at the end of August after a productive return of 680% to its investors from January to April 2021. From August 2021 onwards, the coin has begun to raise and head upwards, forming a resistance level at $2.11. The coin is currently followed by the up-trending line extending from July 20, 2021, and though the price got tested multiple times at the trend line, it failed to descend.

Looking at the technical on the daily chart, the MACD indicator gives a bullish signal as the MACD line is above the signal line, and the histogram chart has initiated to show green candles. There is an immense volume in favor of bulls making an up move of price. The RSI at 73 is in its overbought zone. The price of IOTA got tested numerous times at the uptrend line, but it got rejected and couldn’t break down the trend line and the support line, which indicates that the coin has no intention to descend.
In the weekly timeframe, the coin is firmly following the up-trend line, and the price got rejected several times with swing lows and failed to lessen. There is a formation of the bullish engulfing pattern at the edge of the trend line, although the technical indicators are yet to give a bullish signal.
From the technical perspective, IOTA shows rejection on the downward side. The price can be expected to surge in the upcoming days. If the price crosses the downtrend line in the daily chart, it may reach its high of $2.11.

