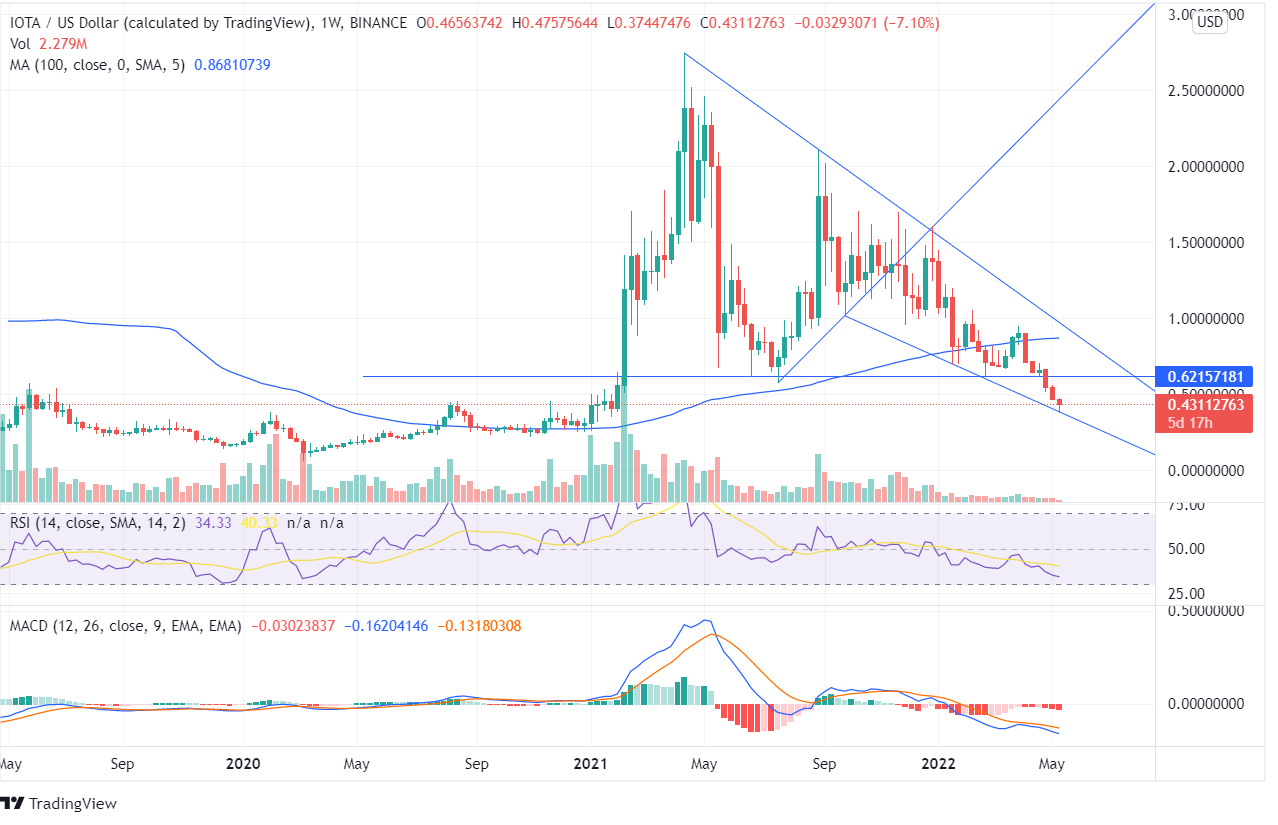
IOTA has descended from its peak of $2.74 to its lows and reached the current price of $0.43. The token had shown constant downfall while closing above the support line of $0.62. But recently, the price even fell below it.
IOTA is moving in the downtrend line over the year and hasn’t even once tested the trend line. The MIOTA coin is moving in a downward channel, and the last candle is currently taking the support of the bottom channel line for a rise on the weekly chart.
An upsurge can be expected if any positive signals from the bulls and the MIOTA price begin to ascend from the current level. Technical parameters on the weekly chart show the coin is already in the bearish zone, and currently, the indicators signal neutral price action.
In the 4-hour time frame chart, a morning star pattern is formed. However, if there is a supportive volume of bulls, an up-trending pattern can be expected in the long run.
On the daily chart, the RSI indicator took a U-turn after reaching its oversold zone and may lead towards its overbought zone as the indicator signals the line of an uptrend move.
The last bullish candle taking the support of the downtrend line can be an opportunity for the bulls. The MACD line has been below the signal line over the past 3 weeks, and the MIOTA value has already reduced significantly.


